
Universal Corporation: Yield Without Growth
A 6% yield backed by stable operations but limited expansion

1. Investment Thesis: Income Stability Supported by Operating Consistency, Not Growth
Universal Corporation UVV 0.00%↑ operates in a narrow but durable position within the tobacco supply chain. The company does not manufacture cigarettes or nicotine products; instead, it processes and distributes leaf tobacco globally to manufacturers. This upstream positioning removes direct exposure to consumer brand competition while tying the business closely to long-term tobacco consumption trends.
The investment case is therefore fundamentally different from traditional tobacco equities. Rather than pricing power or product innovation, Universal’s returns depend on procurement efficiency, supply relationships, and disciplined capital deployment. Over time this has produced a relatively steady earnings base, though one that rarely expands meaningfully.
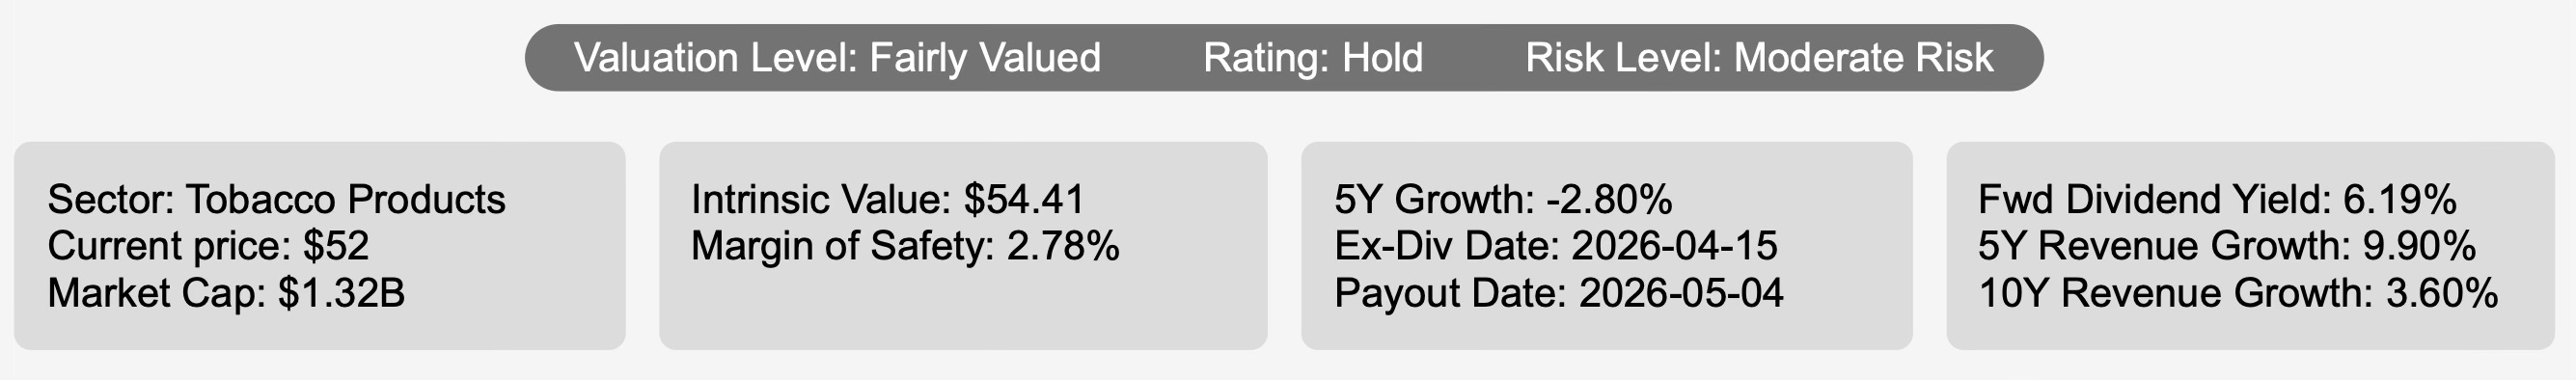
Revenue growth illustrates this balance between resilience and stagnation. Over the last decade revenue grew at 3.6% annually, accelerating to 9.9% over five years. The improvement reflects operating execution rather than structural demand growth, as industry forecasts still point to only about 3% annual expansion over the next decade. The company is effectively operating at the ceiling of what the industry allows.
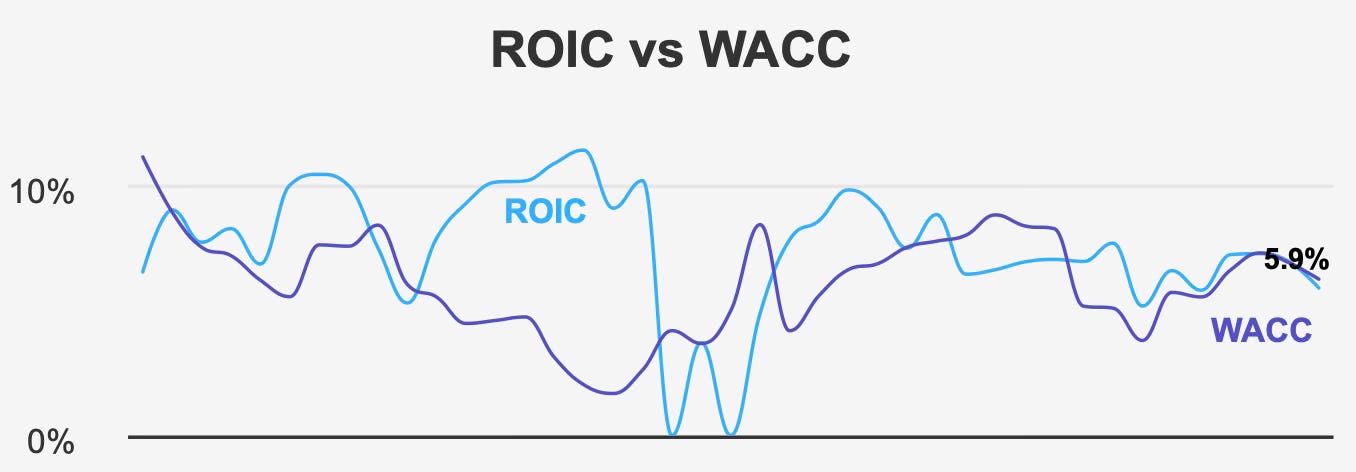
Profitability follows the same pattern. Historically, Universal created modest economic value, with a five-year median return on invested capital of 6.94% exceeding its 6.62% weighted average cost of capital. Recently that advantage narrowed, with current ROIC slipping to 5.90% versus a 6.25% cost of capital. The decline does not indicate deterioration so much as normalization in a low-margin agricultural processing business.
This is a business built to distribute cash, not compound capital. Investors are effectively purchasing a bond-like equity instrument whose returns come largely from income rather than reinvestment.
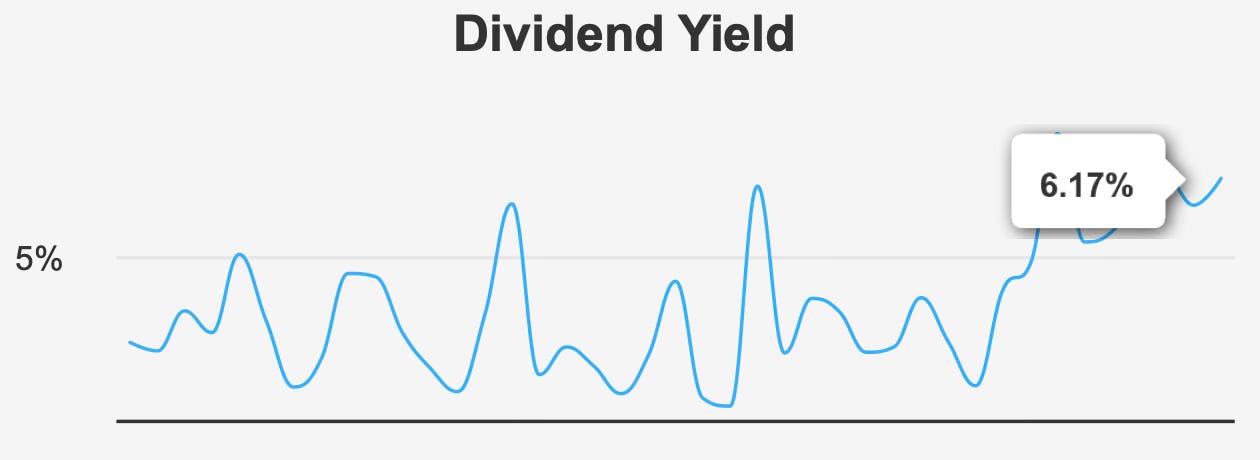
At a forward dividend yield of 6.19%, the shares clearly target income-focused investors. However, the investment outcome depends on whether earnings stability can continue to support a very high payout ratio in a slow-growth environment.
Universal therefore fits a narrow portfolio role: a stabilizing income allocation rather than a total-return growth holding.
2. Earnings Momentum & Profitability Trends
Recent quarterly results highlight the company’s characteristic pattern — stable but uneven profitability driven by agricultural cycles rather than operating leverage.
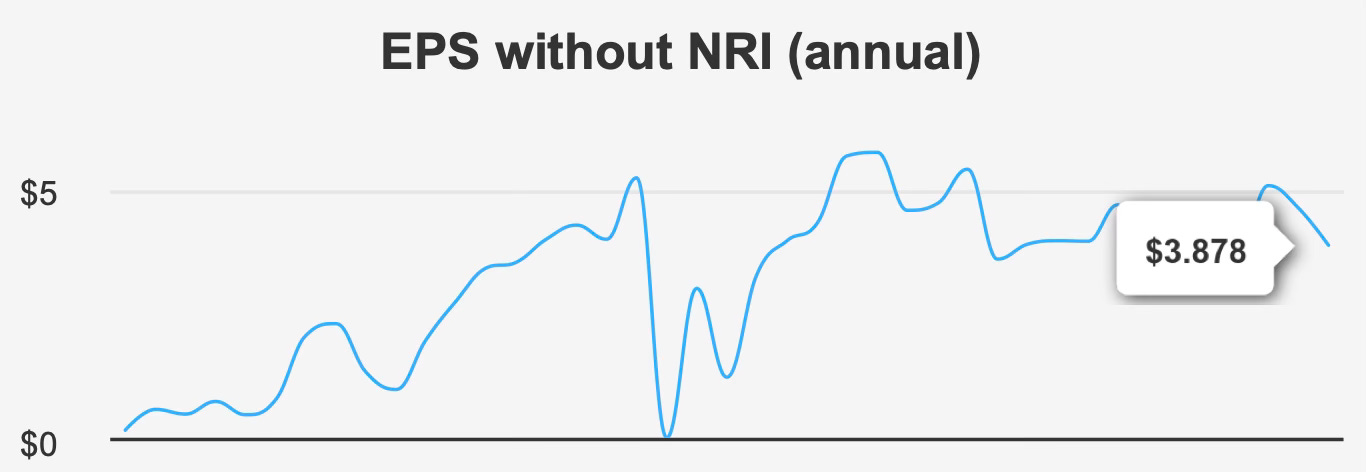
For the quarter ending December 31, 2025, earnings per share excluding non-recurring items came in at $1.338. That was slightly below the prior quarter’s $1.36 and sharply lower than $2.37 in the same quarter last year. The magnitude of the year-over-year change demonstrates how timing of crop processing and shipments can materially affect reported earnings without fundamentally altering long-term performance.
Revenue per share showed a similar seasonal shift. It rose sequentially to $34.193 from $29.953 but declined from $37.275 a year earlier. Over time, however, these fluctuations average out. Five-year EPS growth has compounded at 5.7% annually, while the ten-year rate slows to 1.8%. The widening gap reflects operational improvements layered onto a mature industry rather than structural demand acceleration.
Margins confirm this pressure. Gross margin in the latest quarter was 18.19%, below the five-year median of 19.44% and only modestly above the ten-year low of 17.83%. The company still operates within its historical band, but the direction suggests incremental cost pressure and limited pricing flexibility.
Returns on equity reinforce the same message. The five-year median ROE stands at 6.85%, with the most recent reading at 5.82%. The decline mirrors the recent ROIC compression and indicates that earnings are stabilizing rather than expanding.
Forward expectations remain modest. Analysts project EPS of 4.10 next fiscal year and 4.40 the following year, implying gradual improvement rather than acceleration. Revenue is expected to remain broadly stable with only a slight increase anticipated by 2028.
Overall, Universal’s earnings profile resembles a cyclical utility more than a traditional industrial business. Variability exists quarter to quarter, but long-term profitability gravitates toward a narrow range. This predictability supports dividends but limits valuation expansion.
3. Dividend Profile & Sustainability
Universal’s dividend is the central component of its investment appeal, yet it is also the company’s primary constraint.
The forward dividend yield stands at 6.17%, comfortably above its ten-year median yield of 5.41%. In isolation, that yield would suggest attractive income value. However, the growth record reveals a different reality.
Dividend growth has been negative over recent years, declining 2.8% over five years and 8.0% over three years. Management has effectively prioritized maintaining the payout rather than increasing it.
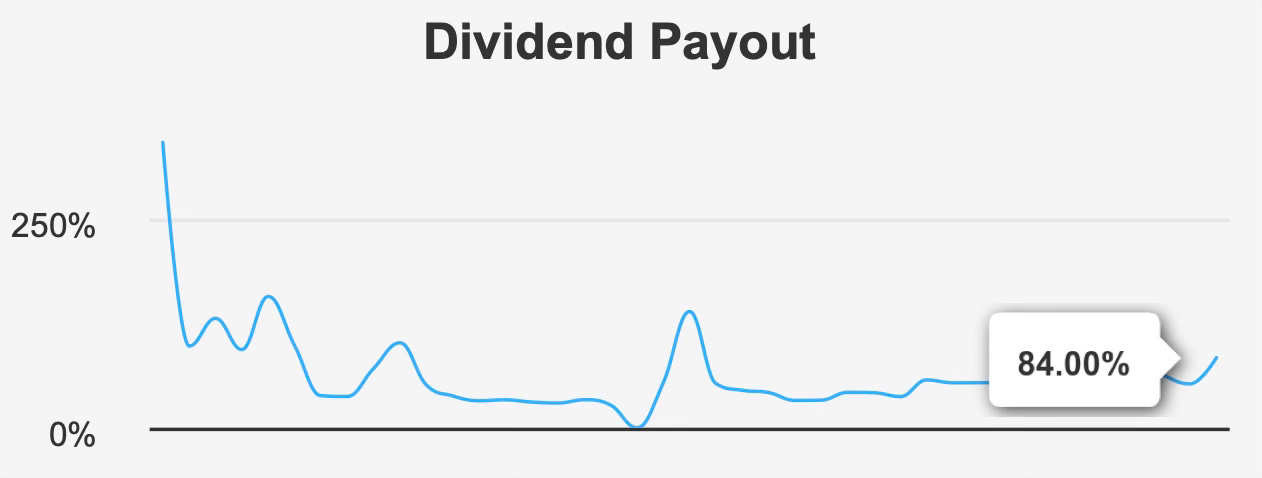
The reason is clear in the payout ratio. For much of the past decade the company distributed roughly 100% of earnings. The current ratio has improved to 84%, but coverage remains thin at 1.04x. This leaves limited room for increases and exposes the dividend to earnings volatility.
This is not a dividend growth story. It is a dividend maintenance story.
From a sustainability standpoint, the payment appears stable but inflexible. The business generates sufficient cash to fund distributions, yet any sustained earnings decline would quickly pressure coverage. Conversely, meaningful dividend growth would require earnings growth beyond what the industry structure realistically provides.
Debt adds another layer to the analysis. The company carries a debt-to-EBITDA ratio of 3.94, placing it in a moderate leverage category. This level is manageable but reduces financial flexibility, especially given the high payout.
Future expectations reflect these constraints. Estimated dividend growth for the next three to five years is effectively 0%, indicating that investors should view the 6% yield as a fixed income stream rather than a rising one.
The payment schedule reinforces the income orientation, with quarterly dividends and the next ex-dividend date on April 15, 2026 followed by a payout on May 4, 2026.
In summary, Universal offers a dependable yield but little growth. The dividend is supported by steady operations, yet structurally capped by both industry dynamics and payout policy.
4. Valuation: Fair Pricing Reflecting Income Value Rather Than Growth Expectations
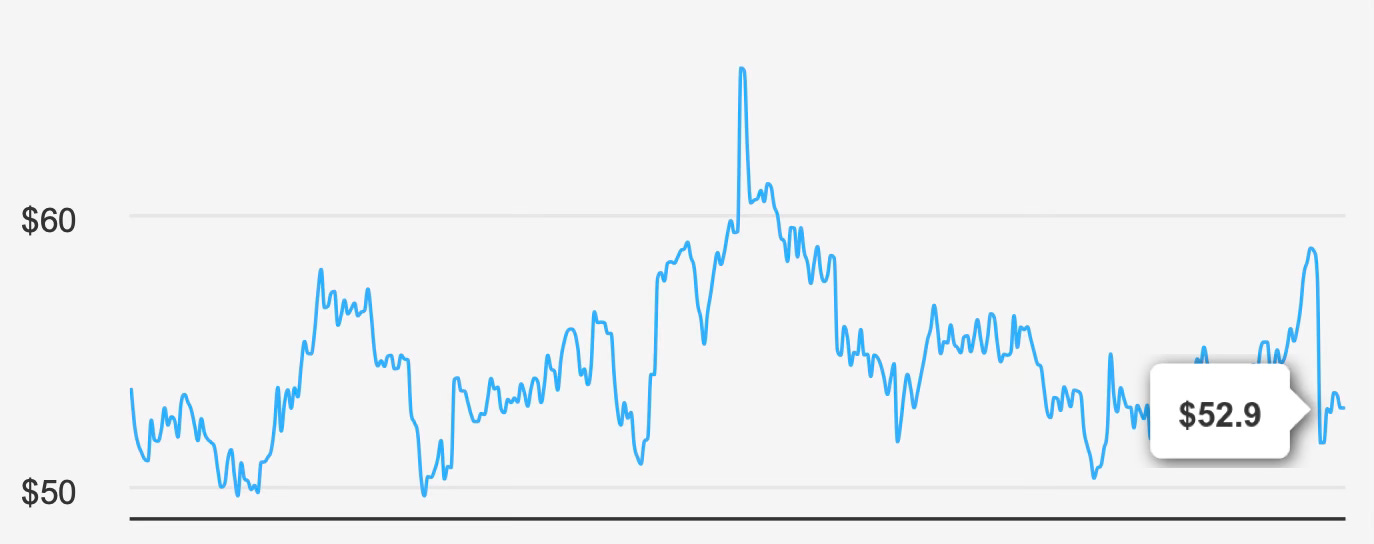
Universal trades at a valuation that mirrors its business model: neither deeply discounted nor meaningfully expensive.
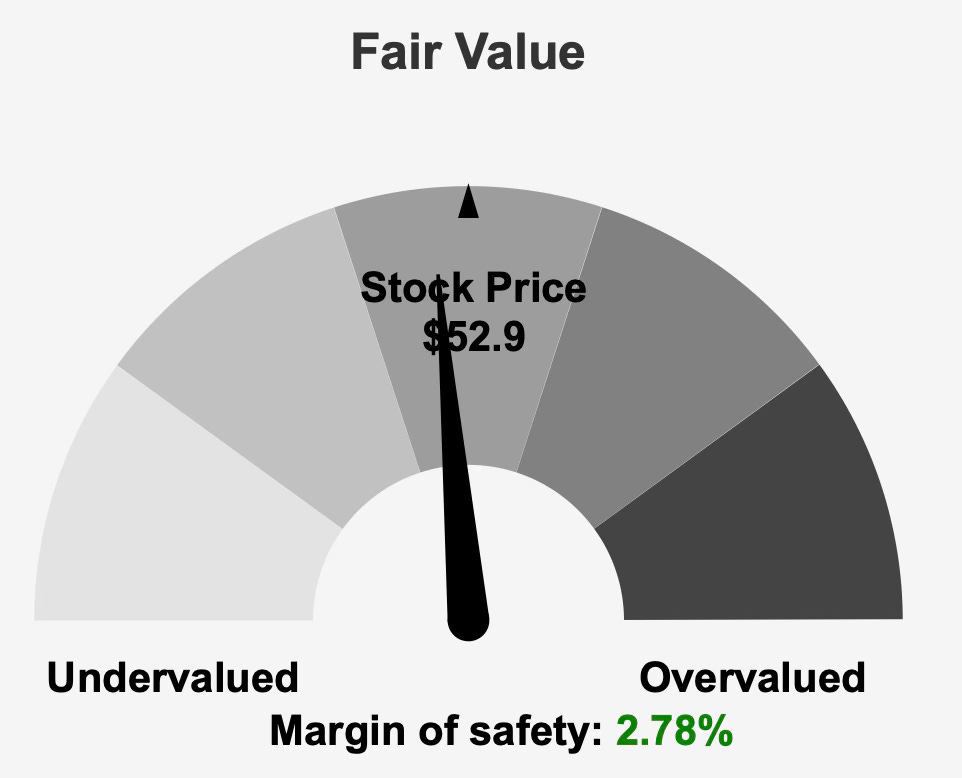
The intrinsic value estimate of $54.41 sits modestly above the current share price near $52, leaving a margin of safety of 2.8%. This narrow gap suggests the market already prices the company as a stable income vehicle.
Earnings multiples reinforce this neutrality. The forward P/E ratio stands at 12.0x while the trailing figure is 15.6x, slightly above the ten-year median of 14.4x. Investors appear willing to pay a small premium for stability but not for growth.
Enterprise valuation tells a similar story. EV/EBITDA is 8.5x, almost identical to its 10-year median of 8.7x. The market is effectively valuing the company at historical norms, indicating expectations of continuity rather than transformation.
Balance sheet-based valuation is somewhat more supportive. The price-to-book ratio of 0.89 sits below its decade median of 0.99, suggesting modest undervaluation relative to net assets. Meanwhile, the price-to-sales ratio of 0.46 lies near a ten-year low of 0.42, reinforcing the idea that revenue streams are conservatively priced.
The outlier is cash flow valuation. The price-to-free-cash-flow ratio of 25.4x stands well above its historical median of 10.8x. This discrepancy likely reflects working-capital volatility rather than permanent deterioration, but it does reduce the margin of safety for income investors relying on cash generation.
Taken together, valuation metrics converge on a clear conclusion: the shares are priced appropriately for a stable, low-growth dividend payer. Upside depends primarily on yield rather than multiple expansion.
5. Risk Assessment & Capital Structure Considerations
Universal’s risk profile stems less from financial instability and more from structural industry limitations.
The company’s Altman Z-score of 2.87 indicates some financial pressure but not distress. Meanwhile, the Beneish M-Score of −2.46 suggests a low probability of earnings manipulation, supporting confidence in reported results.
Leverage remains the most relevant balance sheet factor. Long-term debt increased by $124.3 million over the past three years, and the debt-to-EBITDA ratio of 3.94 limits flexibility during weak earnings periods. Combined with a high payout ratio, this reduces margin for operational shocks.
Operationally, revenue per share has declined year over year, highlighting sensitivity to shipment timing and agricultural cycles. While not unusual for this business, it reinforces why dividend coverage remains thin.
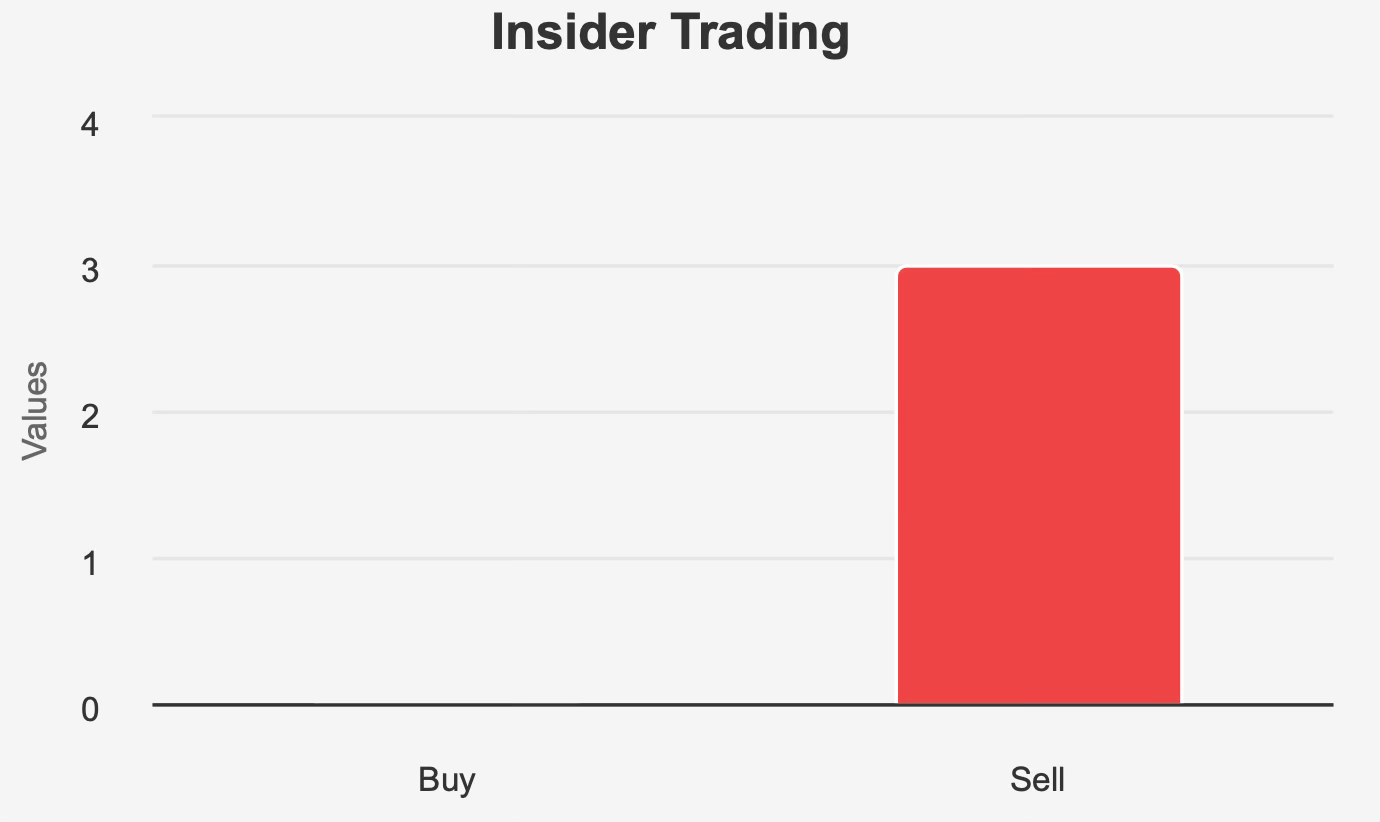
Ownership structure provides mixed signals. Insider ownership is 6.38%, while institutional investors hold 81.05% of shares. The past year included three insider sales and no purchases, which may reflect limited near-term confidence but does not necessarily imply long-term weakness.
Liquidity appears stable, with daily trading volume around 213,736 shares exceeding the two-month average of 199,283 shares. A dark pool index of 60.73% indicates heavy institutional participation, consistent with an income-oriented shareholder base.
Overall, risk centers on three interconnected factors: high payout, moderate leverage, and limited industry growth. None alone threatens the company, but together they constrain upside while increasing sensitivity to earnings variability.
Final Assessment
Universal Corporation represents a classic high-yield stability investment. The company operates in a slow-moving but resilient niche of the tobacco supply chain, producing consistent earnings and dependable income distributions.
Financial performance demonstrates reliability rather than expansion. Long-term EPS growth has averaged in the low single digits, returns on capital hover near the cost of capital, and margins fluctuate within a narrow range. These characteristics support a steady dividend but limit compounding potential.
The dividend itself remains the primary attraction. A yield above 6% offers meaningful income, yet payout ratios near 84% and minimal coverage restrict growth prospects. Investors should view distributions as stable rather than increasing.
Valuation appropriately reflects this reality. Multiples align closely with historical norms, the margin of safety is small, and upside depends largely on collecting income rather than price appreciation.
Risks remain manageable but relevant. Moderate leverage, a structurally slow industry, and tight dividend coverage leave little room for operational setbacks.
For long-term investors, Universal fits best as a portfolio stabilizer — a holding designed to generate cash flow rather than capital appreciation. Returns will likely come primarily from yield, with modest price movement around intrinsic value.
The stock therefore merits a neutral stance: attractive for income preservation, but not compelling for growth-oriented capital allocation.