
SmartCentres REIT: High Yield Meets Limited Growth
Evaluating the sustainability of a 6.6% dividend amid rising leverage and modest earnings momentum

Investment Thesis
Evaluating the Long-Term Investment Case for SmartCentres REIT
SmartCentres Real Estate Investment Trust operates as a diversified Canadian real estate platform focused primarily on retail properties, complemented by residential developments, office buildings, and mixed-use assets. The trust owns and manages a broad portfolio of shopping centers and community-oriented developments located across Canada, generating the majority of its revenue from retail tenants while gradually expanding into residential and mixed-use projects.
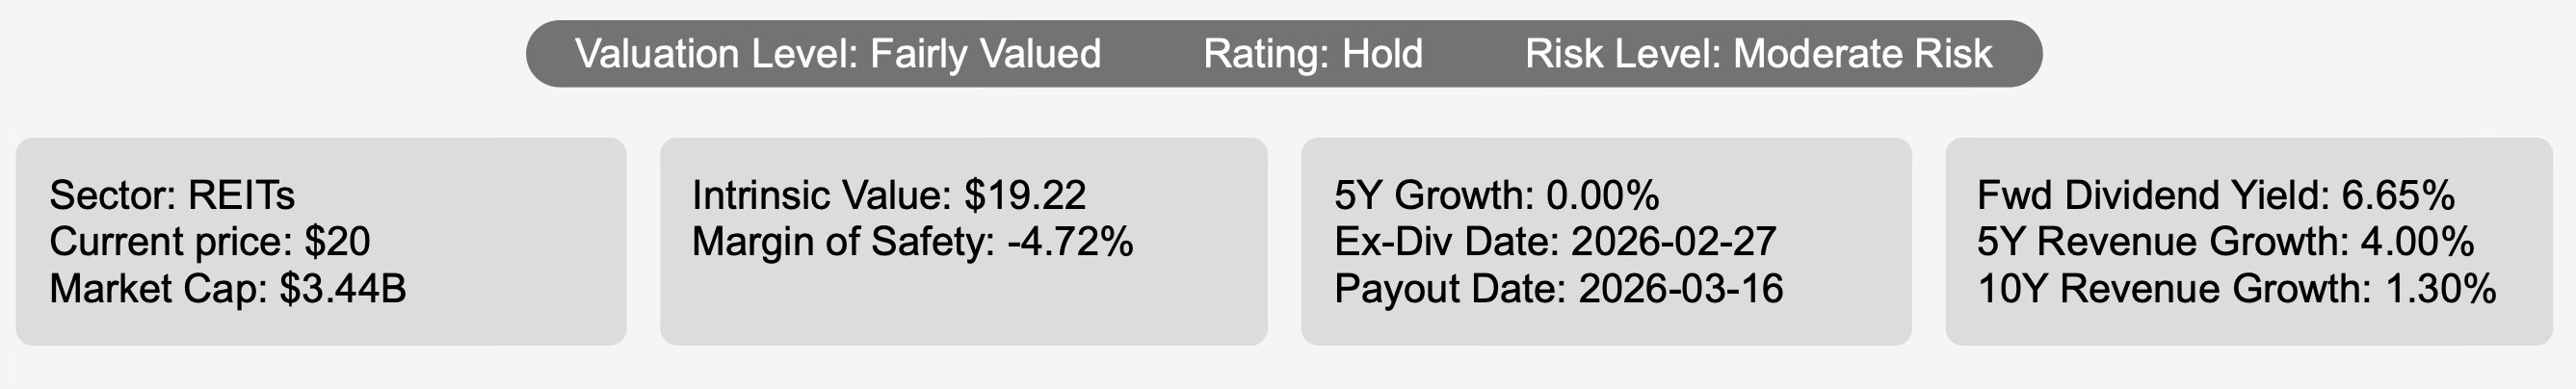
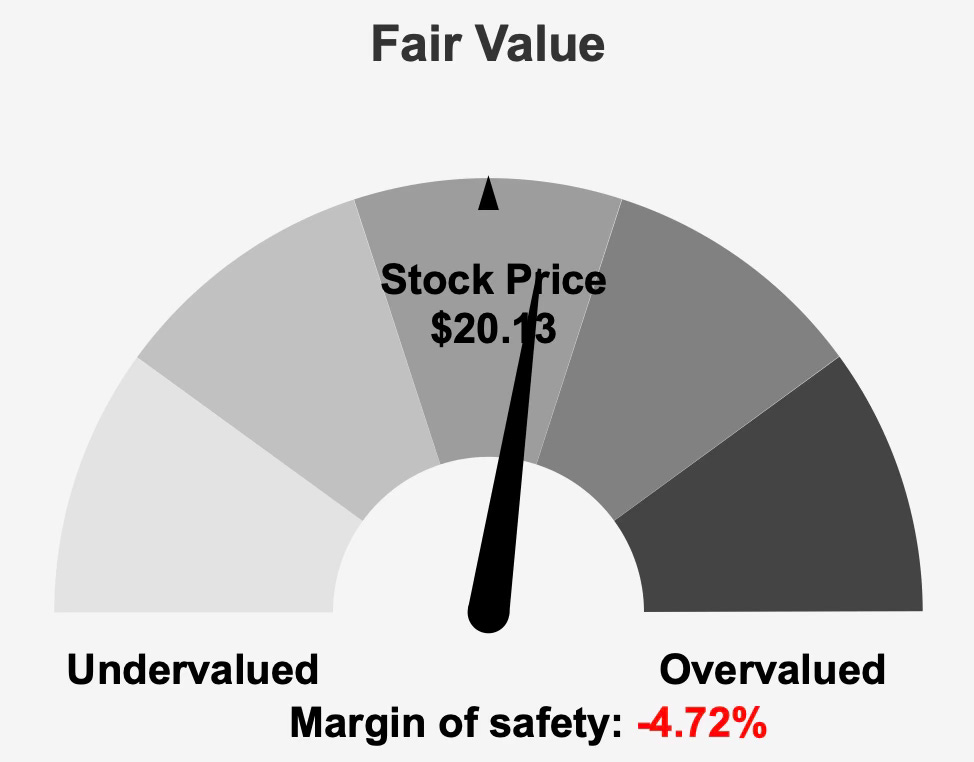
At a market price near $20 per share and a market capitalization of approximately $3.44 billion, the trust sits close to its estimated intrinsic value of roughly $19.22. This implies a modest negative margin of safety of about 4.7%, indicating that the current share price broadly reflects underlying fundamentals rather than offering a clear valuation discount.
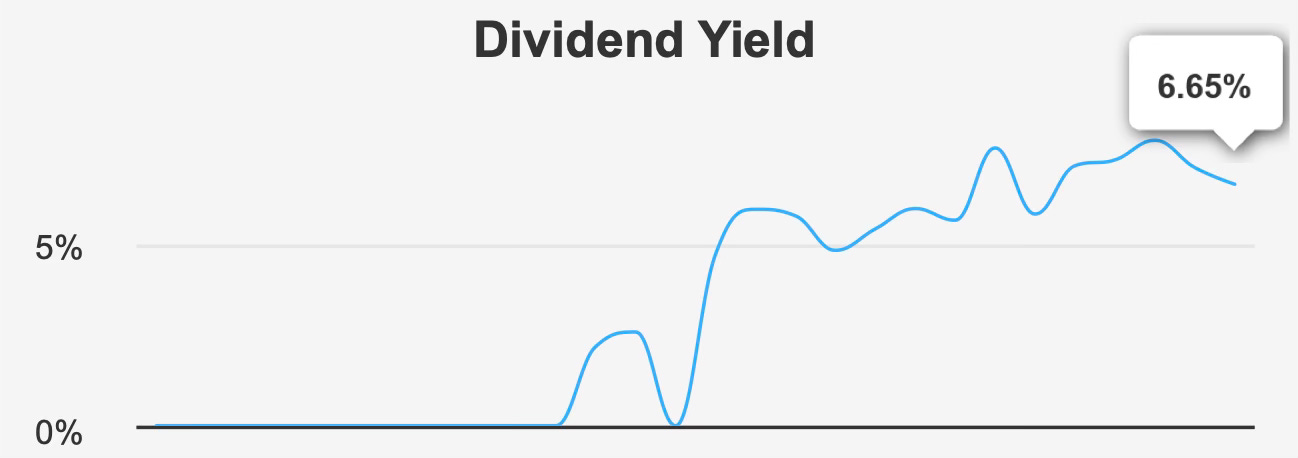
For income-focused investors, the principal attraction is the trust’s forward dividend yield of approximately 6.6%. This yield stands modestly above the company’s 10-year median dividend yield of around 6.3%, suggesting that the stock offers a competitive income stream relative to its historical distribution profile. The trust also distributes dividends monthly, a structure that can appeal to investors seeking consistent cash flow.

However, the broader investment case requires balancing that income appeal against several structural constraints. Revenue growth has been relatively modest over time, with a five-year revenue compound annual growth rate of roughly 4.0% and a ten-year growth rate of only 1.3%. These figures point to a mature portfolio operating in a stable but slow-growing segment of the Canadian property market.
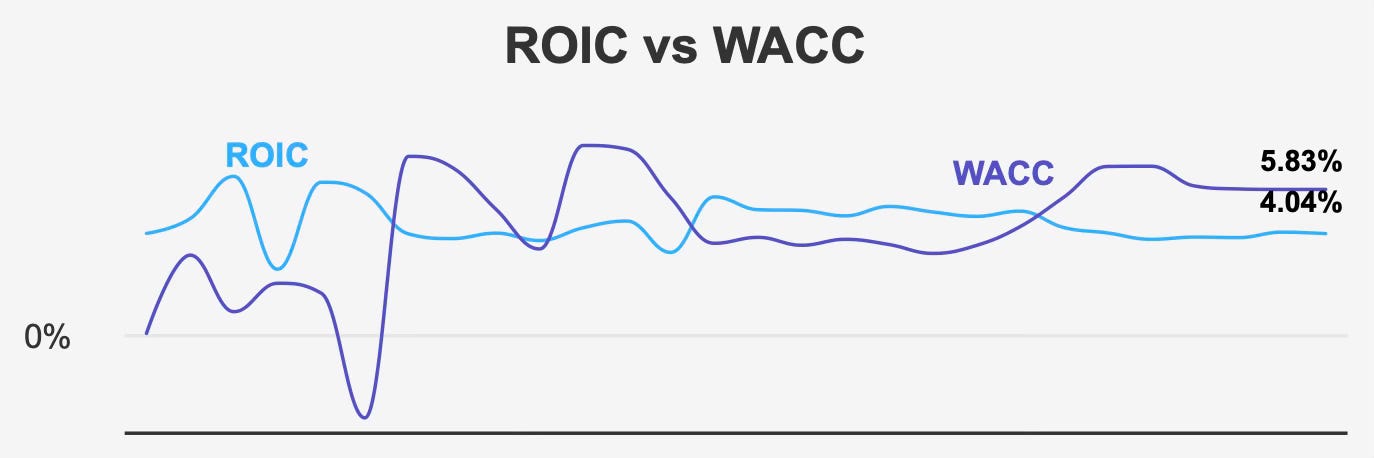
Profitability metrics also indicate a limited capacity to generate excess economic value. The trust’s return on invested capital stands at roughly 4.0%, which trails its weighted average cost of capital of about 5.8%. This gap suggests that, over time, the company has not consistently produced returns sufficient to exceed its cost of capital.
Taken together, these characteristics position SmartCentres as a relatively stable income vehicle rather than a growth-oriented investment. The trust offers an attractive dividend yield supported by a diversified property base, but its long-term investment appeal is moderated by modest growth prospects, elevated leverage, and a dividend payout ratio that currently exceeds earnings.
For long-term investors, the key question is therefore not whether the dividend is attractive—it clearly is—but whether earnings growth and capital efficiency will improve enough to support sustainable distributions over time.
Earnings Momentum & Profitability Trends
Recent operating results illustrate a company delivering incremental improvements but still facing structural limitations in earnings growth.
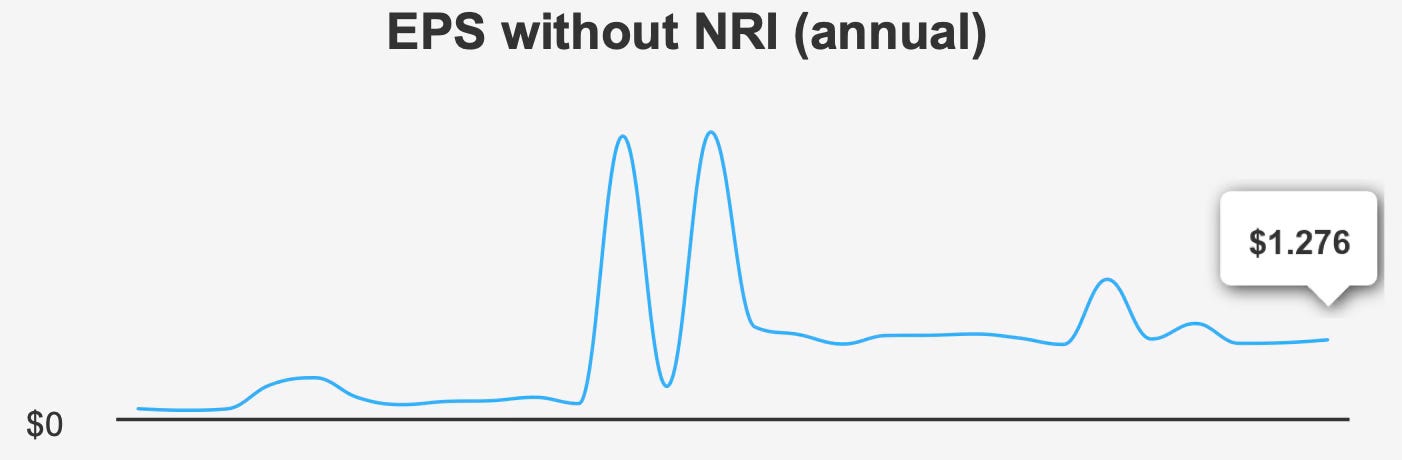
In the most recent quarter ending December 2025, earnings per share excluding non-recurring items reached approximately $0.328. This represents a sequential improvement from $0.311 in the previous quarter and a modest increase from $0.321 recorded in the same period a year earlier.
On a diluted basis, quarterly earnings rose more sharply to roughly $0.449 compared with $0.278 in the preceding quarter. However, this figure remains slightly below the $0.474 reported in the fourth quarter of the prior year, indicating that while quarterly fluctuations may occur, underlying earnings growth remains gradual.
Revenue per share also edged higher to about $1.00 from $0.96 in the previous quarter and $0.95 in the same quarter the year before. These incremental gains reflect steady tenant occupancy and rental income growth, although the pace remains moderate relative to the broader real estate sector.
Looking at longer-term performance trends provides additional perspective. The trust’s five-year compound annual growth rate for earnings per share excluding non-recurring items stands at approximately –2.5%, suggesting that profitability has faced pressure in recent years. Over a ten-year horizon, however, EPS growth turns slightly positive at roughly 0.9% annually, highlighting the stability—but also the stagnation—of earnings over the long term.
Margins have remained relatively consistent despite these growth challenges. Gross margin for the latest quarter was approximately 61.6%, closely aligned with the company’s five-year median level. While this figure sits somewhat below the ten-year median of around 65.5%, it still reflects the stable economics typical of established retail property portfolios.
Capital allocation trends also merit attention. Over the past decade the company has exhibited a buyback ratio of roughly –1.2%, indicating that share issuance has modestly exceeded repurchases. Over the most recent year the buyback ratio was approximately –0.1%, implying only minimal activity in reducing outstanding shares.
This dynamic can weigh on per-share earnings growth over time, particularly when distributions remain high relative to earnings. For a REIT, where capital expenditures and property development often require significant financing, maintaining a balance between equity issuance and shareholder returns becomes critical.
Looking ahead, analyst estimates suggest moderate top-line growth. Revenue is projected to reach approximately $706.2 million in 2026 and rise further to around $724.2 million in 2027.
Earnings expectations also point toward gradual improvement. Analysts estimate earnings per share of roughly $1.44 in the coming fiscal year, increasing to approximately $1.51 the following year.
While these projections suggest a degree of operational stability, they do not indicate rapid earnings expansion. Instead, they reinforce the view that SmartCentres is likely to remain a slow-growth income vehicle whose performance will depend primarily on rental stability, development execution, and disciplined capital allocation.
Dividend Profile & Sustainability
For many investors, the defining feature of SmartCentres REIT is its dividend. With a forward yield of approximately 6.7%, the trust offers a level of income that compares favorably with many other publicly traded property vehicles.
However, a closer examination of the distribution profile reveals several factors that merit careful consideration.
First, dividend growth has effectively been absent in recent years. Both the three-year and five-year dividend growth rates stand at 0.0%, indicating that the distribution has remained unchanged over that period. While a stable dividend can still serve income investors well, the lack of growth limits the trust’s ability to offset inflation or increase shareholder returns over time.
Second, the payout ratio currently stands at approximately 104%. In practical terms, this means the company is distributing more cash in dividends than it generates in earnings. Such a ratio raises questions about the sustainability of the dividend if earnings do not improve.
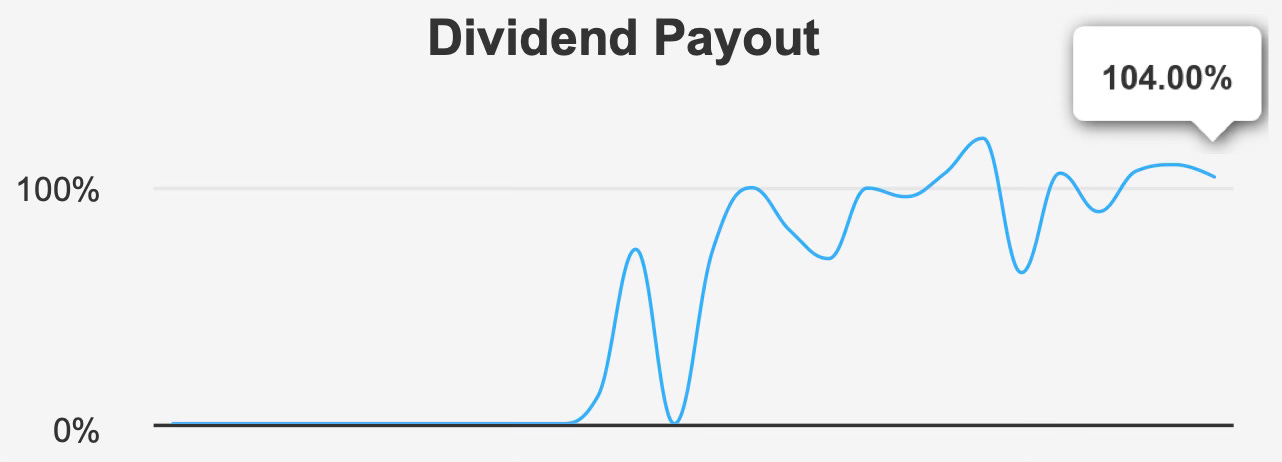
Dividend coverage provides another perspective. The coverage ratio of roughly 0.81 indicates that earnings alone are insufficient to fully support the current distribution level. While REITs often rely on funds from operations rather than traditional earnings metrics to assess dividend coverage, a payout ratio exceeding 100% still signals limited financial flexibility.
Leverage further complicates the picture. The trust’s debt-to-EBITDA ratio stands at approximately 10.4, substantially higher than the commonly cited threshold of around 4.0 for moderate leverage. This elevated debt burden increases sensitivity to interest rates and can constrain future capital allocation decisions.
The outlook for dividend growth reflects these constraints. Current estimates suggest that dividend growth will remain at approximately 0.0% over the next three to five years. In other words, investors should expect the distribution to remain stable rather than increase meaningfully.
Nevertheless, the trust continues to offer predictable cash flows supported by a large portfolio of income-producing properties. Its monthly distribution structure may also enhance its appeal for investors seeking regular income payments.
Ultimately, the sustainability of the dividend will depend on modest earnings growth, disciplined capital spending, and effective management of leverage.
Valuation
Assessing Current Market Pricing Relative to Historical Multiples and Intrinsic Value
At current levels, SmartCentres REIT appears broadly aligned with its estimated intrinsic value, suggesting that the market has already priced in most of the trust’s current strengths and limitations.
The estimated intrinsic value of approximately $19.22 sits slightly below the recent market price of roughly $20.13, resulting in a modest negative margin of safety of around 4.7%. This narrow gap indicates that the shares are trading near fair value rather than offering a significant discount.
Valuation multiples paint a similarly mixed picture.
The trailing price-to-earnings ratio currently stands at about 18.7x, which is somewhat above the company’s 10-year median multiple of approximately 16.2x. This suggests that the market is assigning a slight premium relative to historical norms, possibly reflecting expectations for modest earnings improvement.
Looking forward, however, the valuation appears more moderate. The forward P/E ratio is estimated at roughly 14.0x, implying that projected earnings growth could gradually bring the multiple closer to long-term averages.
Sales-based valuation metrics present a more balanced view. The trailing price-to-sales ratio stands at approximately 5.1x, which is modestly below the ten-year median of about 6.1x. This suggests that the market may be valuing revenue somewhat conservatively relative to historical levels.
Enterprise value metrics indicate a somewhat higher valuation. The trailing EV/EBITDA multiple of around 22.1x exceeds the ten-year median of approximately 19.3x, implying that the stock appears relatively expensive when assessed against operating earnings.
On the other hand, the price-to-book ratio stands at roughly 0.9x, which is below the historical median of around 1.07x. This discount could indicate that the market is applying a conservative valuation to the trust’s property assets, potentially reflecting concerns about leverage, growth prospects, or asset quality.
The price-to-free-cash-flow ratio of approximately 12.5x sits slightly below its historical median, suggesting that cash flow valuation remains reasonable.
Overall, these valuation signals point to a stock that is neither clearly undervalued nor significantly overpriced. Instead, the market appears to be balancing the trust’s attractive income yield against its moderate growth outlook and elevated leverage.
Risk Assessment & Capital Structure Considerations
A number of structural risks influence the long-term investment outlook for SmartCentres REIT.
Perhaps the most significant is the gap between the trust’s return on invested capital and its cost of capital. With ROIC around 4.0% compared with a weighted average cost of capital of roughly 5.8%, the company has not consistently generated returns sufficient to create economic value.
This dynamic can limit long-term shareholder returns, particularly if capital expenditures or development projects fail to produce returns above financing costs.
Leverage represents another key risk factor. The trust’s debt-to-EBITDA ratio of approximately 10.4 indicates a high level of indebtedness relative to operating earnings. In periods of rising interest rates or declining property valuations, such leverage could place pressure on cash flow and restrict strategic flexibility.
Liquidity concerns also warrant attention. Average daily trading volume over the past two months has been around 26,000 shares, suggesting relatively thin trading activity. Low trading volume can increase price volatility and widen bid-ask spreads, making it more difficult for investors to enter or exit positions efficiently.
Ownership structure may also influence market dynamics. Insider ownership currently stands at 0%, while institutional ownership is approximately 15%. The absence of insider holdings may raise questions about management alignment with shareholder interests, although it could also reflect structural compensation practices common among certain REITs.
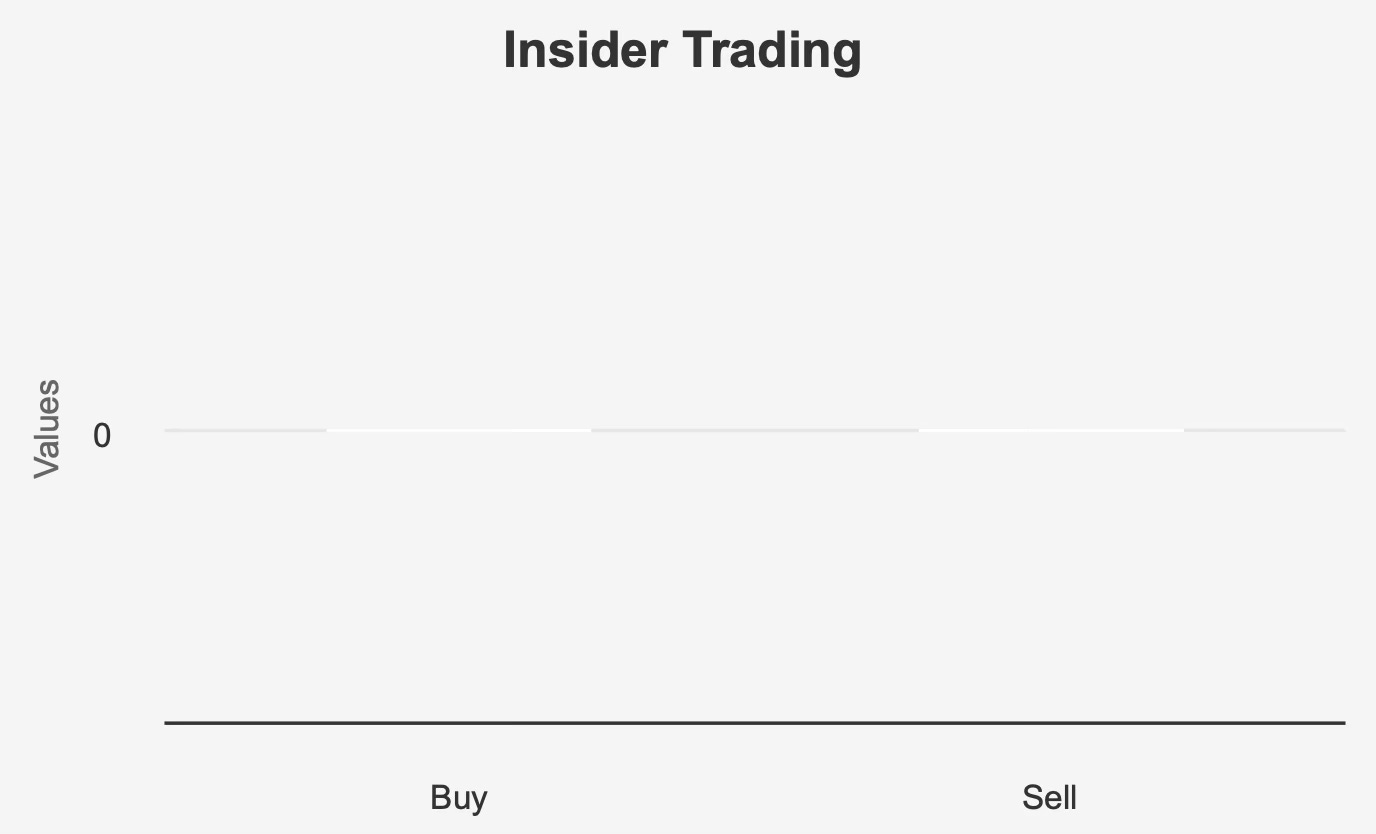
Finally, the absence of insider trading activity over the past year provides limited insight into management sentiment. While this neutrality does not necessarily signal concern, it also does not provide a strong signal of insider confidence.
Final Assessment
SmartCentres REIT occupies a distinctive position within the Canadian real estate investment landscape. The trust combines a diversified property portfolio with a relatively high dividend yield, making it attractive to investors seeking steady income from commercial real estate assets.
However, the company’s long-term investment profile remains constrained by modest growth prospects and elevated leverage. Earnings growth has been gradual, dividend expansion has effectively stalled, and profitability metrics indicate limited economic value creation relative to the cost of capital.
At current valuation levels, the shares appear close to fair value. The market seems to recognize both the strengths and limitations of the business: stable income generation supported by a large property portfolio, offset by modest earnings growth and a dividend payout ratio that exceeds earnings.
For income-focused investors willing to accept moderate risk, SmartCentres REIT may continue to serve as a steady yield vehicle. However, without stronger earnings growth or meaningful improvements in capital efficiency, the potential for significant capital appreciation appears limited.
As a result, the stock presently aligns with a Hold-oriented investment stance, offering attractive income but limited upside in the absence of operational improvements or a more compelling valuation discount.