
Realty Income: Reliable Yield, Limited Upside
A steady monthly dividend backed by durable leases - but capital efficiency keeps long-term returns modest.

Investment Thesis: Durable Income Franchise Trading Near Fair Value With Limited Internal Compounding
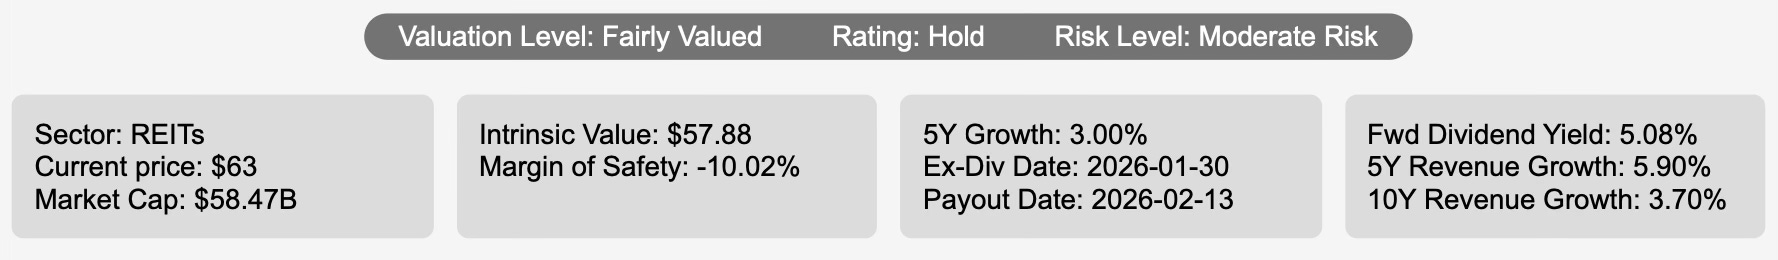
Realty Income O 0.00%↑ operates one of the largest net-lease real estate portfolios in public markets, owning approximately 15,600 properties across 49 states and Puerto Rico leased to 250 tenants spanning 47 industries. The company’s traditional emphasis on freestanding, single-tenant retail properties has gradually broadened, with industrial, gaming, manufacturing, office, and distribution assets now accounting for roughly one-fifth of revenue. The expansion improves diversification but does not materially alter the economic structure of the business.
The investment model remains straightforward: long-duration triple-net leases produce predictable rental income while tenants absorb operating costs. This structure creates unusually stable margins and allows the company to support a monthly dividend that functions almost like a contractual income stream for shareholders. The shares therefore attract investors seeking income reliability rather than cyclical upside.
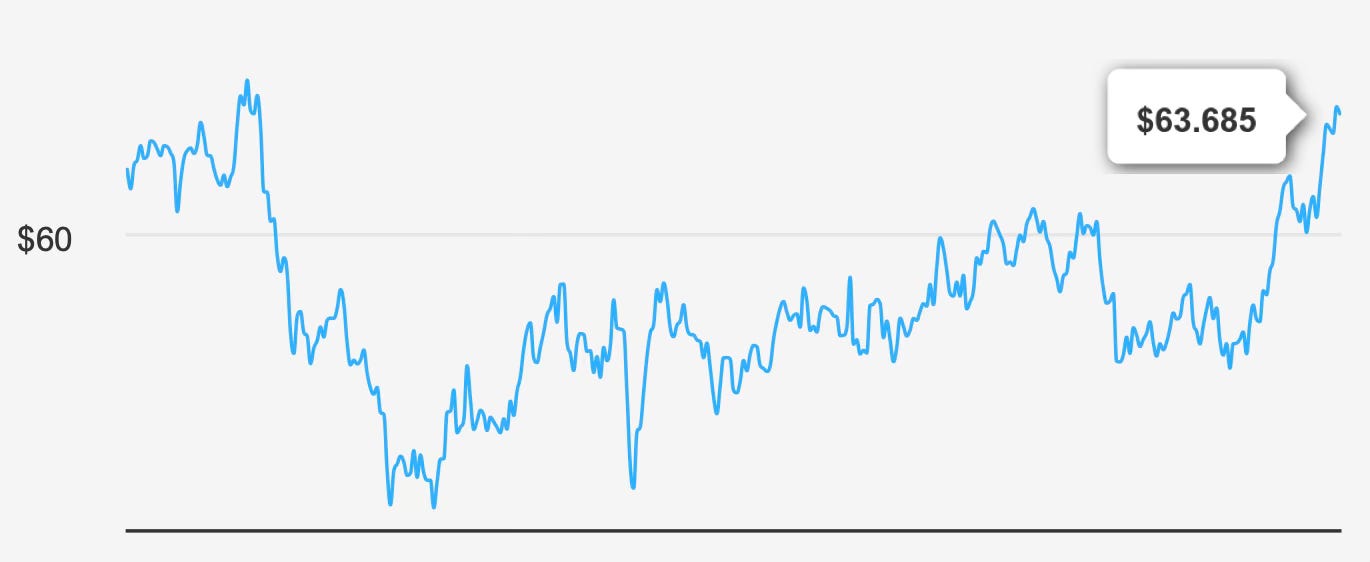
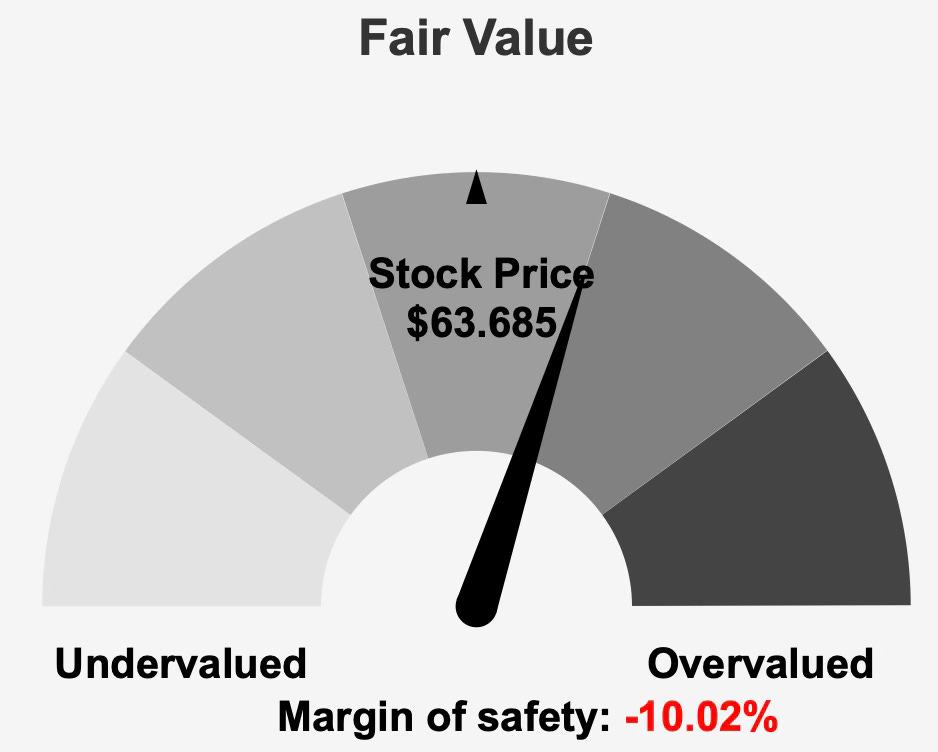
At approximately $63 per share versus intrinsic value near $57.88, the stock trades modestly above fair value, implying a margin of safety around negative 10.0%. The market is effectively pricing stability at a premium. Investors buying today are not purchasing recovery potential or a cyclical rebound — they are purchasing certainty.
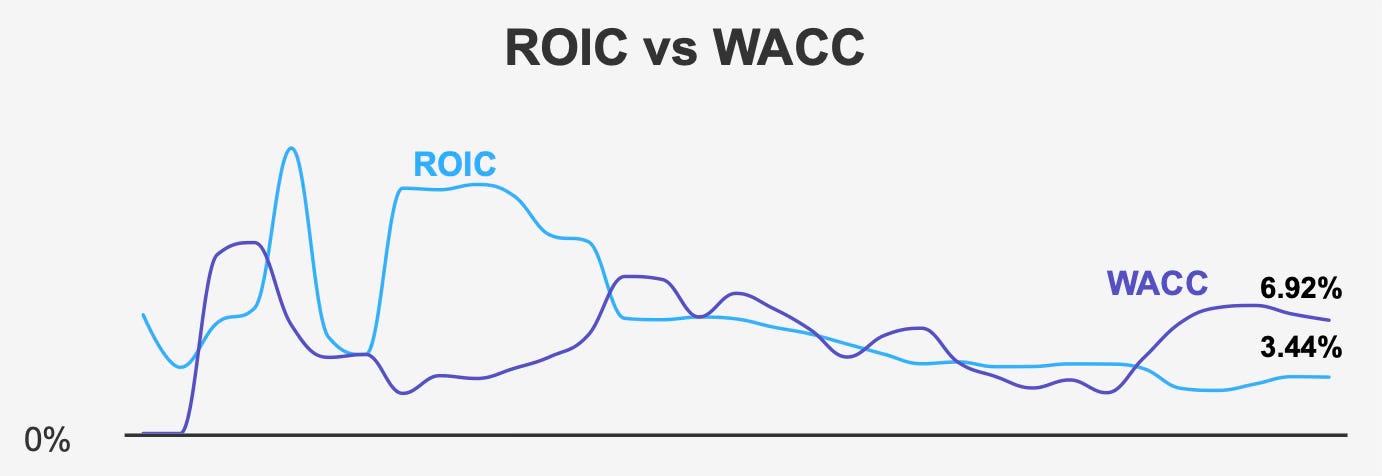
The central tension in the investment case lies in capital efficiency. Realty Income generates returns on invested capital near 3.4% while its cost of capital approaches 6.9%. Over time, this gap limits the rate at which intrinsic value can grow even as the asset base expands. The company can become larger without becoming materially more profitable on a per-dollar basis.
As a result, expected shareholder returns rely primarily on income rather than appreciation. The stock behaves less like a compounding equity and more like a yield instrument with modest growth attached. For investors seeking predictable cash flow and portfolio stability, that profile remains attractive. For investors seeking accelerating value creation, the structure imposes clear limitations.
2. Earnings Momentum & Profitability Trends: Predictable Expansion Driven by External Growth Rather Than Operating Leverage
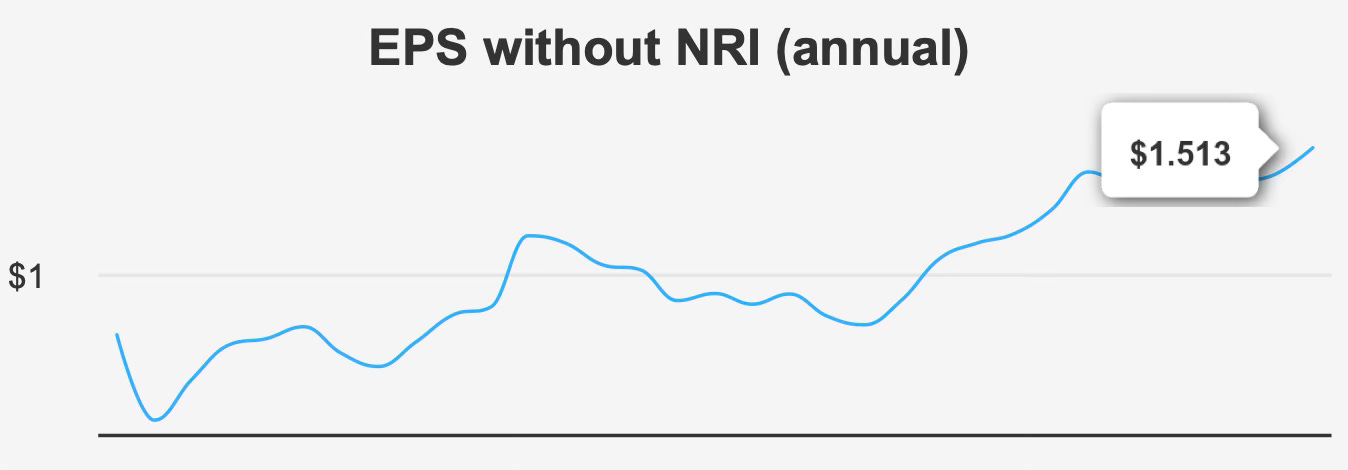
Recent quarterly results show incremental improvement. In the third quarter ending September 30, 2025, adjusted EPS excluding non-recurring items reached $0.391, rising from $0.325 in the prior quarter and $0.291 a year earlier. Diluted EPS improved to $0.35 from $0.22 sequentially and $0.30 year over year.
These gains appear encouraging in isolation, but the longer trend reveals a much steadier picture. Annual adjusted EPS declined slightly around 0.2% over five years while increasing about 4.1% over ten years. This indicates growth occurs slowly over long periods rather than compounding rapidly. The company scales consistently, but per-share economics evolve gradually.
Revenue dynamics reinforce the same pattern. Revenue per share is approximately $1.516, modestly above the prior quarter yet below earlier 2025 levels. Analysts expect revenue to grow from roughly $5.60 billion in 2025 to $6.27 billion by 2027, while EPS is projected to rise from $1.300 to $1.578. These projections imply steady low-single-digit expansion rather than acceleration.
Operating profitability remains exceptionally stable. Gross margin near 92.6% sits close to its decade range of roughly 92.2% to 93.9%. Such consistency demonstrates the strength of the triple-net lease model: tenants pay operating costs, insulating the landlord from inflation volatility. However, the same feature limits upside because margins cannot expand meaningfully.
Capital allocation ultimately explains the slow growth profile. The five-year median return on invested capital around 3.0% remains below the cost of capital near 6.9%, meaning expansion adds scale more than value. Historically, growth has been funded through equity issuance, reflected in a five-year buyback ratio near negative 22.9%, though dilution slowed to about negative 5.1% in the past year.
This pattern is typical for large net-lease REITs. Earnings growth depends primarily on acquiring additional properties rather than improving existing property profitability. The business therefore produces dependable but measured expansion, more comparable to infrastructure income than to operating company growth.
3. Dividend Profile & Sustainability: Reliable Monthly Income With Modest Growth and Structural Constraints
The dividend remains the defining characteristic of Realty Income. The forward yield sits around 5.1%, comfortably within its historical range of roughly 3.4% to 6.5%. The monthly distribution schedule differentiates the company from most equities and appeals particularly to income-focused investors who value predictable cash flows.
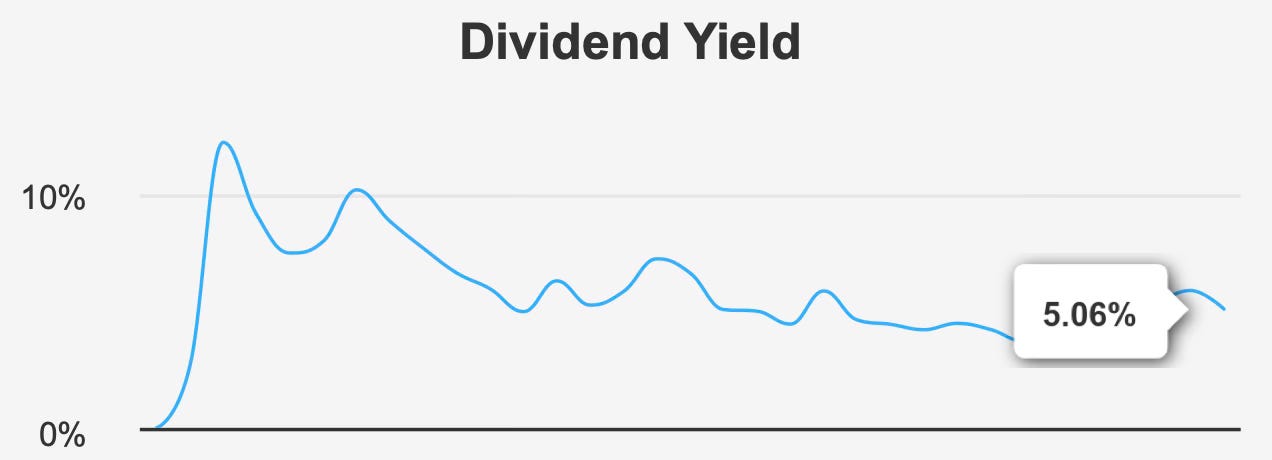
Growth is intentionally restrained. The dividend has increased about 3.0% annually over five years and roughly 3.3% over three years, with forward growth expectations near 2.8%. These increases track underlying earnings expansion and signal a conservative distribution philosophy centered on sustainability rather than rapid escalation.
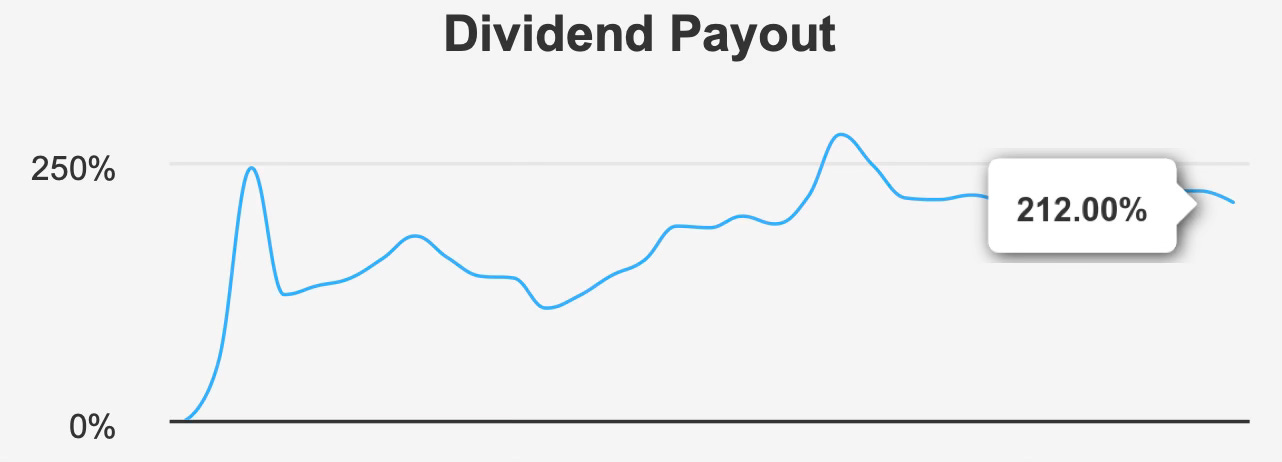
Coverage metrics require careful interpretation. The payout ratio is approximately 212%, far above the ten-year median near 102%, and dividend coverage is about 0.34x. Accounting earnings therefore do not fully support distributions. In a REIT structure, depreciation distorts earnings, but the magnitude still indicates reliance on capital access and ongoing portfolio expansion.
Leverage further shapes sustainability. Debt-to-EBITDA is approximately 6.2x, above commonly preferred levels around 4.0x. Elevated leverage does not threaten immediate solvency given stable lease income, but it reduces flexibility if borrowing costs rise or capital markets tighten. Dividend safety depends as much on financing conditions as on tenant performance.
The most likely future path is continued small annual increases rather than material acceleration. Realty Income appears committed to maintaining its distribution record, yet growth will remain closely tied to acquisition spreads and cost of capital rather than internal margin expansion.
4. Valuation: Fair Pricing Reflecting Stability Rather Than Embedded Growth Expectations
At roughly $63 compared with intrinsic value near $57.88, Realty Income trades modestly above fair value. Investors are paying a premium for predictability rather than for future expansion.
Earnings-based multiples appear elevated. The trailing P/E ratio is about 59.0x compared with a long-term median around 51.7x, and forward P/E approximates 39.7x. Even allowing for REIT accounting effects, the valuation reflects confidence in stability rather than growth potential.
Asset-based metrics provide a more balanced perspective. EV/EBITDA near 18.8x sits slightly below its historical median around 20.2x, price-to-book around 1.5x is below its long-term 1.96x average, and price-to-free-cash-flow near 15.2x is modestly below its typical level near 17.0x. These measures indicate the real estate itself is not expensively priced relative to historical norms.
Analyst targets around $63.61 reinforce the idea of equilibrium valuation. The market broadly expects the stock to behave as an income instrument rather than a capital appreciation vehicle.
Total return expectations therefore approximate dividend yield plus low-single-digit growth. Without a meaningful shift in interest rates or capital efficiency, multiple expansion appears unlikely.
5. Risk Assessment & Capital Structure Considerations: Interest-Rate Sensitivity and Value Creation Constraints
The principal risk facing Realty Income is financial structure rather than operational instability. Over three years, the company issued approximately $7.1 billion in debt, increasing leverage and interest-rate exposure. With Debt-to-EBITDA above 6x, refinancing conditions materially influence future shareholder returns.
Growth efficiency is another concern. Asset growth around 32.6% annually significantly exceeds revenue growth near 5.9%, implying acquisitions add scale faster than profitability. Without improved acquisition spreads, expansion may dilute economic returns.
Operating margin has declined about 3.2% annually, reinforcing the view that growth relies more on capital markets than operational improvement. The Altman Z-score near 1.11 indicates elevated financial stress risk over a multi-year horizon, though not immediate distress.
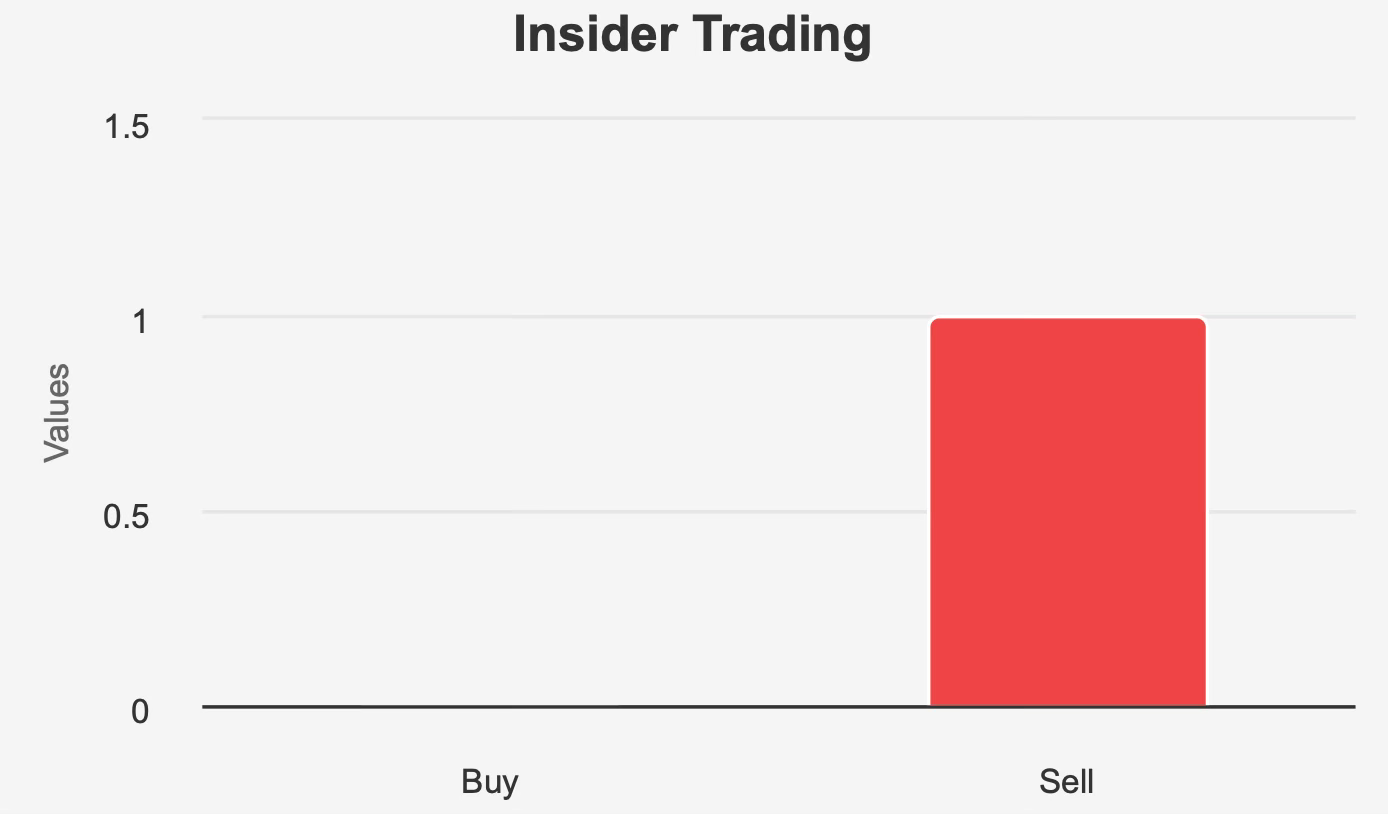
Ownership patterns provide additional context. Insider ownership remains low at roughly 0.21% with minimal recent buying, while institutional ownership around 78.5% suggests the shareholder base prioritizes stability and income consistency. Trading behavior supports this interpretation, as reduced public volume alongside dark-pool activity near 48% indicates long-term positioning rather than speculative turnover.
Overall risk centers on capital costs and financing availability. The properties themselves produce stable rent; the balance sheet determines long-term shareholder outcomes.
Final Assessment: Reliable Income Anchor With Limited Appreciation and Predictable Return Profile
Realty Income remains a high-quality income REIT built around dependable lease cash flows and consistent distributions. The roughly 5.1% yield combined with steady 3% growth offers a predictable return stream suitable for conservative portfolios.
Yet the same characteristics that make the company stable also constrain upside. Returns on capital remain below the cost of capital, leverage is elevated, and dividend coverage depends partly on financing conditions. These factors do not undermine the business model but limit intrinsic value expansion.
Valuation near fair value reinforces the conclusion. Expected total returns will likely mirror dividend yield plus modest growth rather than appreciation driven by improving economics.
For income-focused investors seeking stability, the shares serve well as a core holding. For investors seeking compounding value growth, the opportunity set may be more limited.
Realty Income therefore functions best as a portfolio stabilizer — a reliable income anchor designed to support overall portfolio balance rather than lead performance.