
Procter & Gamble: Durable Cash Flows at a Fully Valued Price
Reliable shareholder returns, modest growth, and little margin of safety

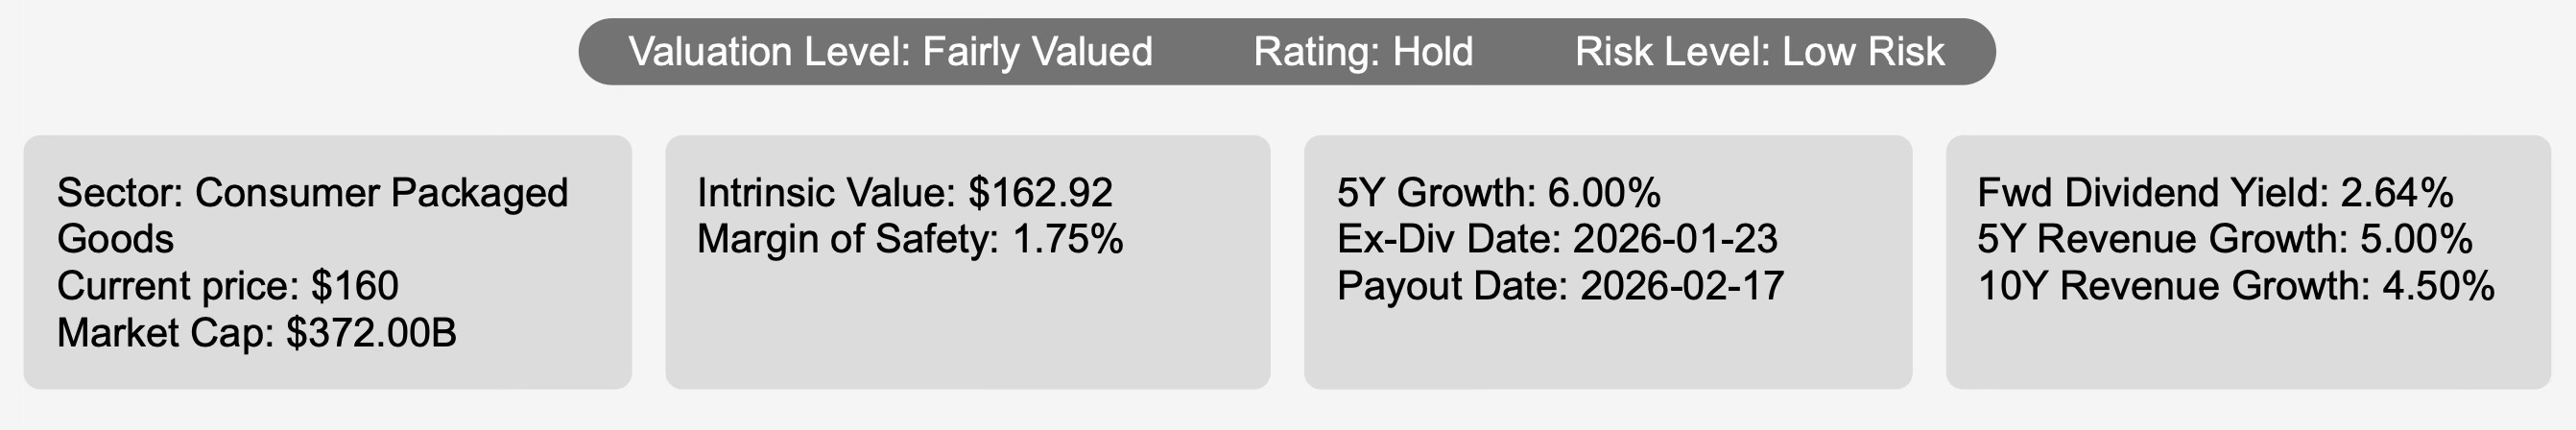
Investment Thesis: Durable Consumer Franchise Offering Reliable Income but Limited Upside at Current Pricing
Procter & Gamble PG 0.00%↑ stands among the most established global consumer goods franchises, tracing its origins to 1837 and now generating nearly $85 billion in annual sales across a portfolio of household brands. More than 20 individual brands produce over $1 billion in yearly revenue, and international markets account for slightly more than half of consolidated sales.
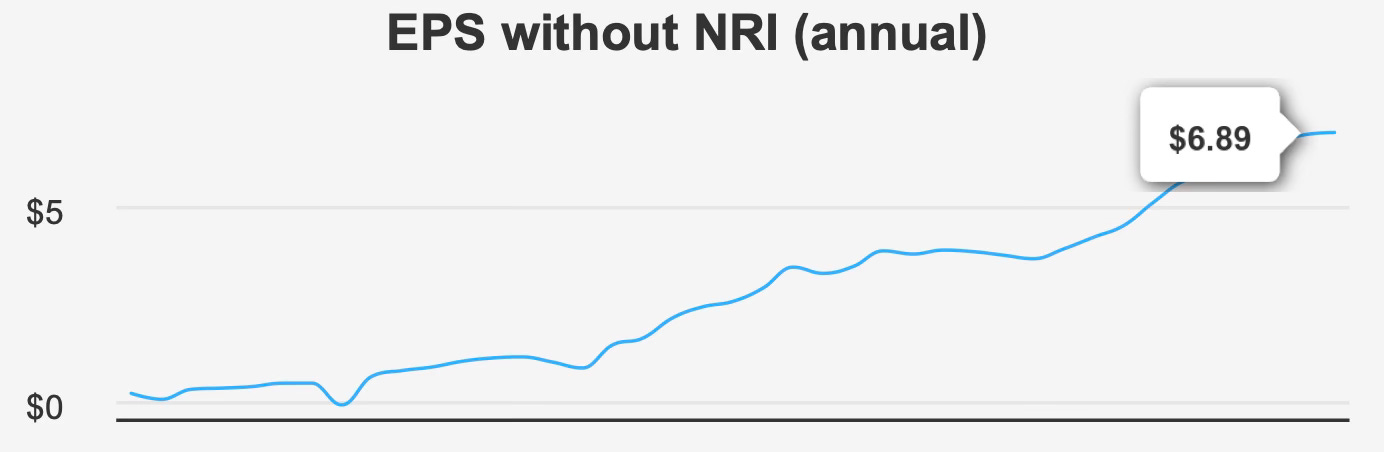
The investment appeal rests primarily on consistency rather than acceleration. The company has historically grown earnings at a measured pace, supported by pricing power, brand strength, and disciplined capital allocation. Over the past decade, earnings per share excluding non-recurring items expanded at a 7.0% compound rate, while the five-year pace moderated to 5.6%. These figures frame the business as a steady compounding enterprise rather than a cyclical growth story.
Forward expectations reinforce this characterization. Analysts project fiscal-year 2026 earnings of $6.879 per share and $7.248 in 2027, implying continued mid-single-digit growth consistent with the company’s historical trajectory. Industry forecasts similarly point to moderate expansion over the next decade, aligning closely with P&G’s long-term pattern rather than suggesting structural acceleration.
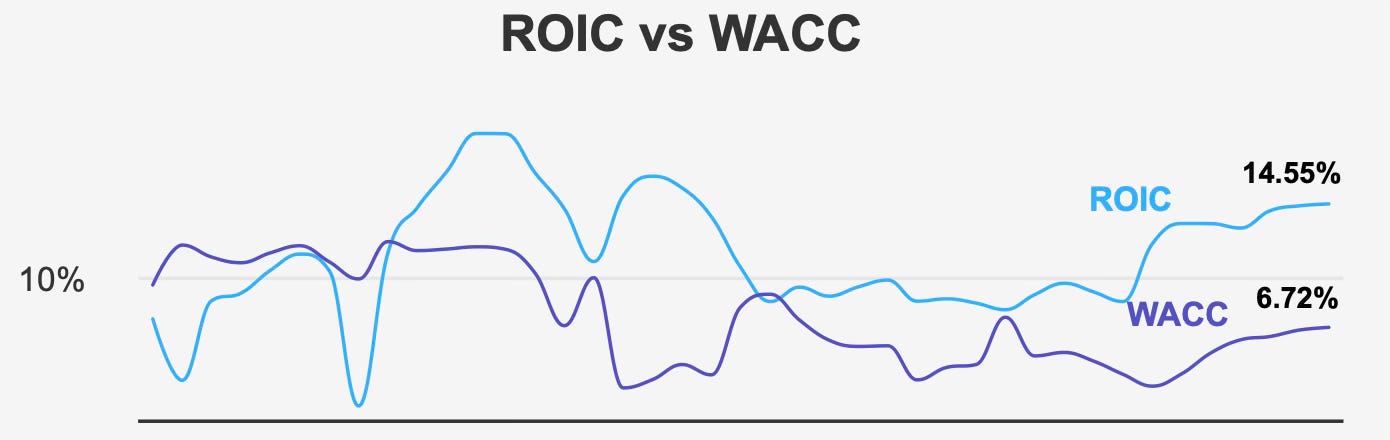
Crucially, this growth is accompanied by high economic profitability. Return on invested capital currently stands at 14.55% versus a 6.72% cost of capital, indicating persistent value creation. A five-year median ROIC of 13.31% exceeding a 5.93% WACC further confirms that this advantage is structural rather than temporary.
From a dividend perspective, this combination — predictable demand, durable margins, and returns well above capital cost — supports a long-duration income thesis. However, the shares currently trade near estimated intrinsic value, limiting prospective total return primarily to earnings and dividend growth rather than valuation expansion.
In practical terms, the stock functions best as a portfolio stabilizer and income compounder rather than a capital appreciation vehicle at the current price.
Earnings Momentum & Profitability Trends
Recent quarterly results illustrate the stability of P&G’s earnings profile but also its limited operating leverage. For the quarter ending December 31, 2025, earnings excluding non-recurring items were $1.88 per share, unchanged year over year but down from $1.99 in the preceding quarter. Diluted EPS declined to $1.78 from $1.95 sequentially and from $1.88 a year earlier.
Revenue per share showed a mild decline quarter-to-quarter at $9.162 versus $9.187 but improved compared with $8.902 the prior year. The pattern — steady annual progress but periodic quarterly variability — is typical of a mature consumer staples company where pricing and mix matter more than volume growth.
Margins remain strong but stable rather than expanding materially. Gross margin registered 50.68%, slightly below the five-year median of 51.16% and marginally under the ten-year peak of 51.39%. This narrow range underscores both the durability of the business model and the limited room for operational surprise. Efficiency improvements tend to offset cost pressures rather than produce sustained margin expansion.
Capital allocation provides an incremental boost to per-share growth. The company repurchased 0.9% of outstanding shares over the past year and averaged 1.4% annually over the last decade. While modest, this activity consistently supports EPS growth and partially compensates for slower organic expansion.
The most important profitability indicator is the spread between return on capital and cost of capital. With ROIC more than double WACC, P&G converts incremental investment into economic profit rather than merely accounting earnings. Combined with a 31.43% return on equity, the data indicates strong pricing power and efficient capital usage.
Overall earnings momentum can be characterized as predictable rather than dynamic. Growth in the 5–7% range is supported by pricing discipline, brand loyalty, and modest share repurchases. The absence of volatility is a defining feature — beneficial for income investors but limiting for those seeking accelerating earnings expansion.
Dividend Profile & Sustainability
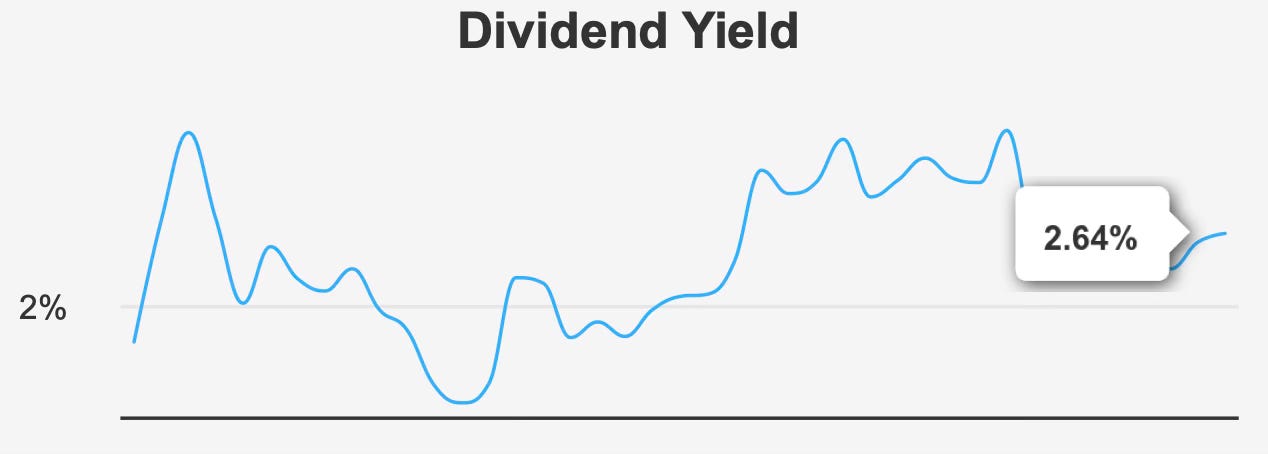
The dividend remains the central pillar of the investment case. The company’s forward yield stands at 2.64%, slightly above its ten-year median of 2.52%. The premium relative to history suggests investors currently receive marginally better income compensation than usual, though not dramatically so.
Growth has been steady rather than aggressive. Dividends have increased at a 6.0% annual rate over five years and 5.0% over three years. Forecast growth moderates modestly to approximately 4.84%, aligning with earnings expectations and reinforcing sustainability.
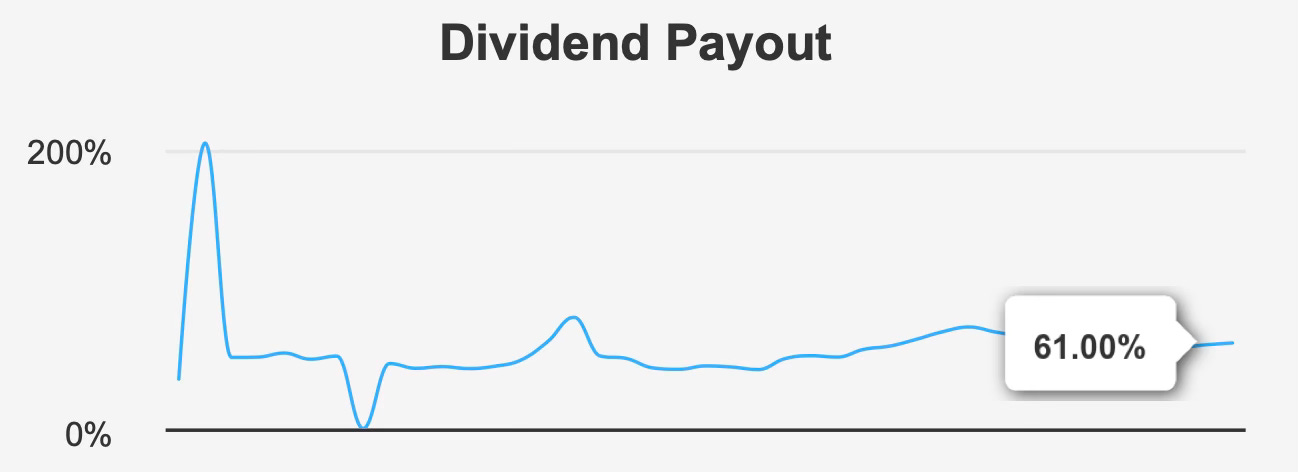
Coverage remains comfortable. The payout ratio is 61%, supported by a dividend coverage ratio of 1.62. Historically, the company’s payout ratios have exceeded 100% at times, making the current level conservative by comparison.
Balance sheet strength further supports income reliability. Debt-to-EBITDA is 1.5, well below the 2.0 level typically associated with elevated financial risk. The Altman Z-score of 5.64 indicates very low bankruptcy risk, while a Beneish M-Score of -2.6 suggests clean accounting practices.
Dividend payments also maintain consistent timing. The most recent ex-dividend date was January 23, 2026, with payment scheduled February 17, 2026 and the next expected around April 24, 2026. Predictability of distribution cadence is particularly valuable for income-oriented portfolios.
The sustainability picture therefore rests on three reinforcing factors: moderate payout ratio, low leverage, and stable earnings growth. The dividend does not rely on financial engineering or unusually high payout assumptions; instead, it tracks underlying earnings expansion closely.
The main limitation is yield level. At roughly mid-2% range, the stock offers reliability rather than high income. Long-term total return will depend largely on the compounding of modest dividend growth rather than immediate yield.
Valuation: Fair Value Pricing Implies Returns Will Track Business Growth Rather Than Multiple Expansion
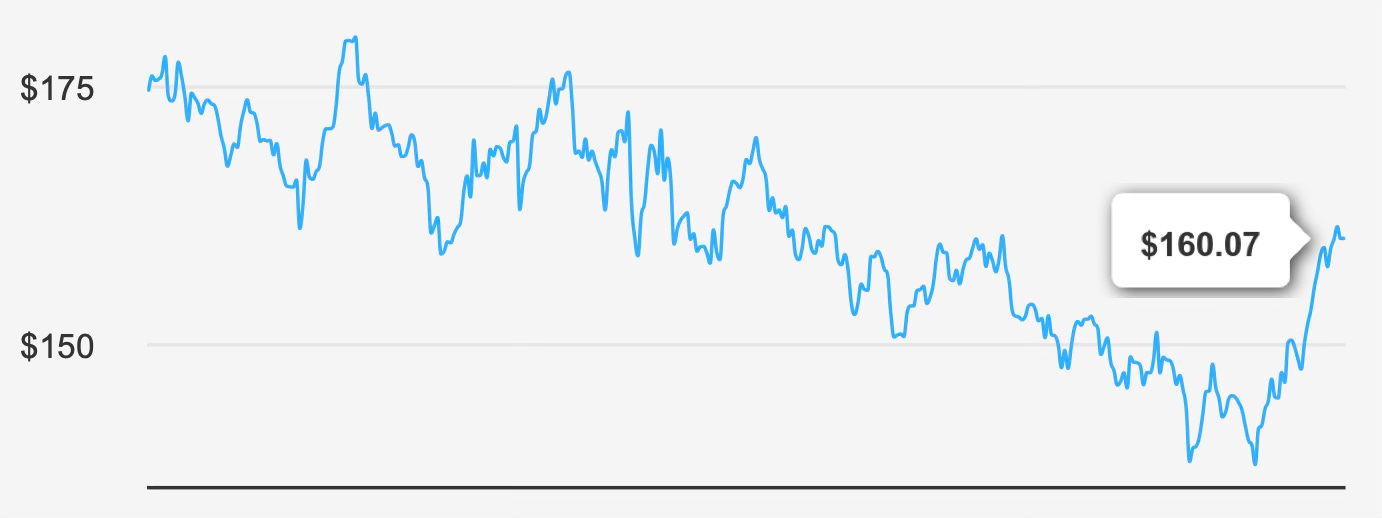
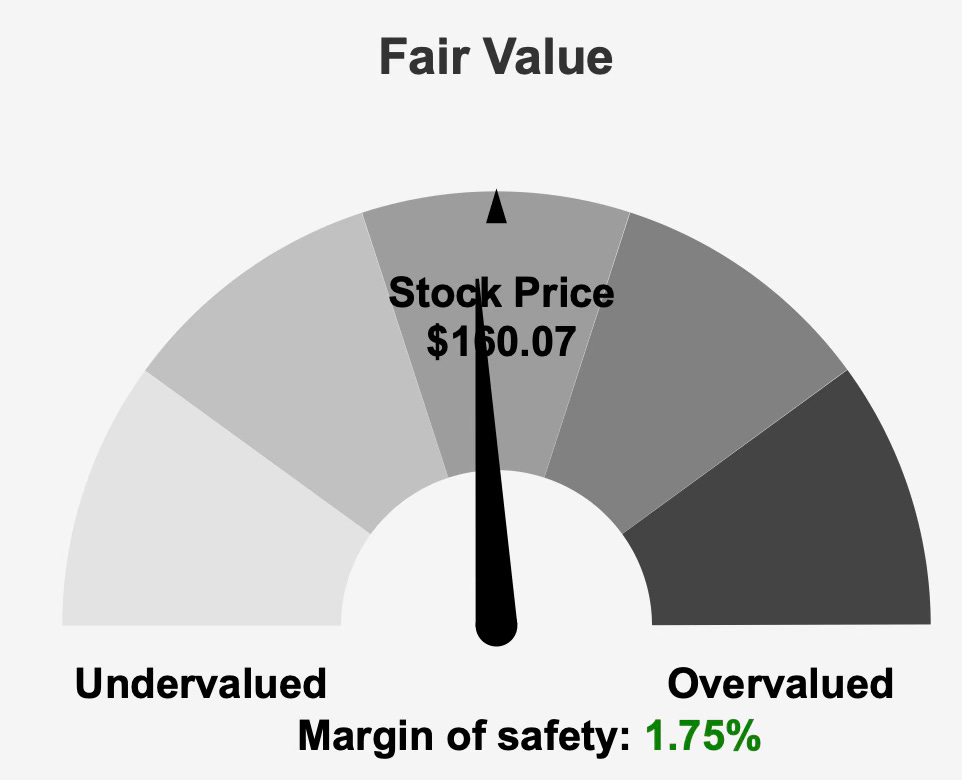
The shares trade near estimated intrinsic value, limiting valuation-driven upside. The current price is about $160 compared with an intrinsic value estimate of $162.92, implying only a 1.75% margin of safety.
Relative valuation metrics reinforce this conclusion. The trailing P/E ratio stands at 23.7x, modestly below the ten-year median of 25.3x. This suggests the stock is not expensive relative to its own history, but also not discounted.
Forward earnings expectations place the multiple at 23.0x, consistent with a moderate growth outlook rather than expansion. Similarly, EV/EBITDA of 16.3x sits below its long-term 18.0x median, while price-to-sales at 4.5x closely matches its historical norm.
The price-to-book ratio of 7.1x and price-to-free-cash-flow multiple of 26.3x are slightly elevated relative to historical medians of 7.0x and 24.9x, respectively. These metrics indicate investors continue to pay a premium for predictable cash generation.
The valuation message is clear: investors are paying approximately the long-term average price for long-term average growth. Analyst targets near $167.53 suggest modest upside, but not enough to materially alter the expected return profile.
Therefore, future returns will likely approximate the sum of earnings growth and dividend yield — roughly mid-single-digit growth plus a mid-2% yield — rather than benefiting from multiple expansion.
Risk Assessment & Capital Structure Considerations
Operational risk remains low but not absent. Revenue growth has slowed recently, raising questions about volume expansion and consumer demand dynamics. For a mature staples company, prolonged growth deceleration could gradually pressure valuation multiples.
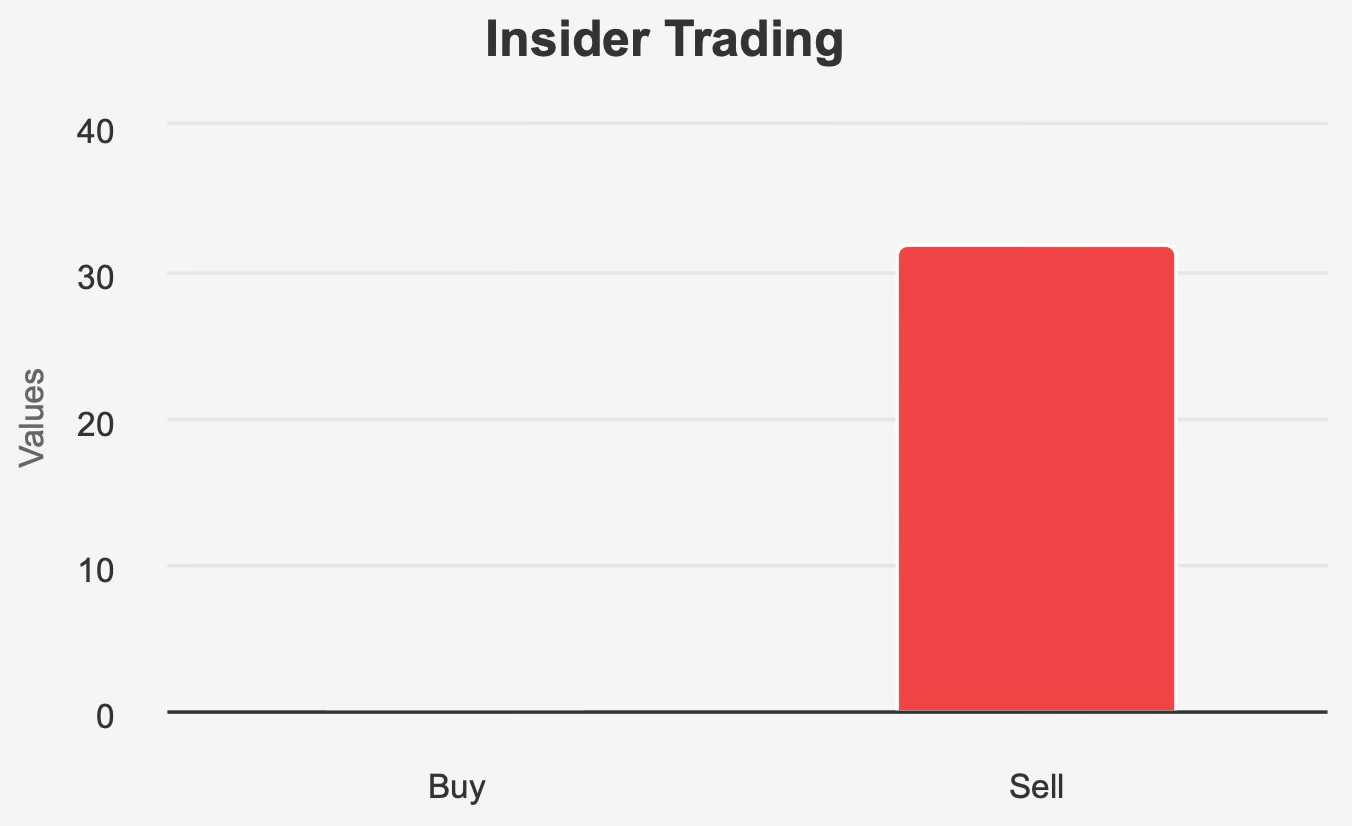
Insider activity presents a softer concern. Over the past year, insiders executed 32 sales with no purchases, including five sales in the last three months. While insiders own only 0.30% of shares, persistent selling can signal limited near-term upside expectations.
Institutional ownership of 68.11% helps offset this concern by providing stability in the shareholder base. High institutional participation typically reduces volatility and supports liquidity, which is reinforced by daily trading volume exceeding 13.8 million shares versus an 11.2 million two-month average.
Financial risk is minimal. Low leverage, strong returns on capital, and high Altman Z-score collectively indicate resilience even during economic downturns. The defensive nature of consumer staples demand further mitigates cyclical exposure.
The main risk is valuation compression rather than business deterioration. Because the company already trades near fair value, any earnings disappointment could translate directly into lower share prices without the protection of a valuation cushion.
Final Assessment
Procter & Gamble represents a classic defensive dividend holding: durable brands, consistent profitability, moderate growth, and dependable income distribution. The company earns returns well above its cost of capital, maintains a conservative balance sheet, and supports a steadily growing dividend with a manageable payout ratio.
However, the stock’s current valuation removes most of the margin of safety. Trading near intrinsic value and historical multiples, expected returns will likely mirror business performance rather than benefit from re-rating. Investors should therefore view it primarily as an income compounder rather than a source of outsized capital appreciation.
For long-term investors seeking reliability and portfolio stability, the shares remain attractive. For those prioritizing total return potential, the entry price matters significantly. At present levels, the investment case is strongest for holding existing positions and accumulating during market pullbacks rather than aggressive buying.
In summary, Procter & Gamble offers quality and dependability — but only average return prospects when purchased at fair value.