
McCormick & Co.: A Steady Dividend Compounder Trading Below Intrinsic Value
Durable brand power, disciplined capital allocation, and mid-single-digit growth underpin a compelling income profile

Investment Thesis: Durable Brand Leadership, Defensive Cash Flows, and Measured Undervaluation
McCormick & Co. MKC 0.00%↑ stands as the global leader in spices, herbs, seasonings, and flavor solutions, supported by more than 135 years of operating history and a portfolio that extends well beyond its flagship brand. Approximately 40% of sales are generated outside the United States across 150 countries and territories, underscoring both geographic diversification and global brand strength. Its customer base spans retail grocery, quick-service restaurants, and packaged food manufacturers, embedding the company across multiple layers of the food value chain.
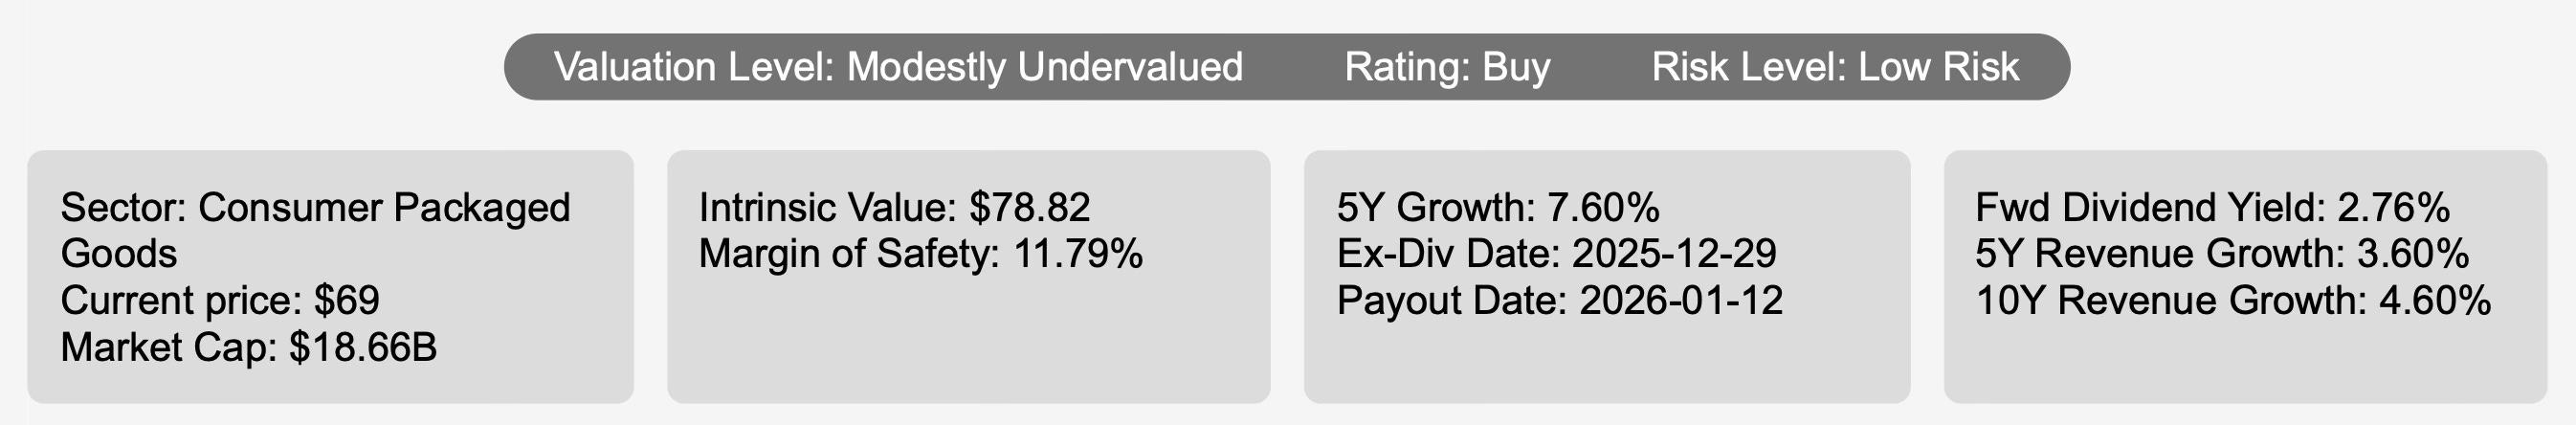
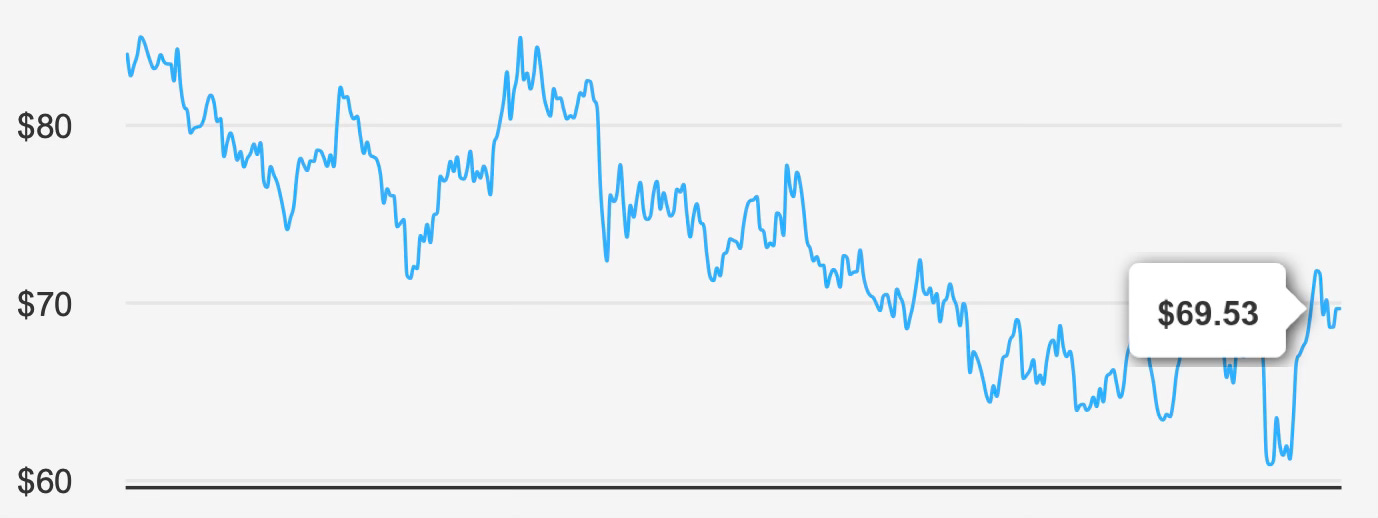
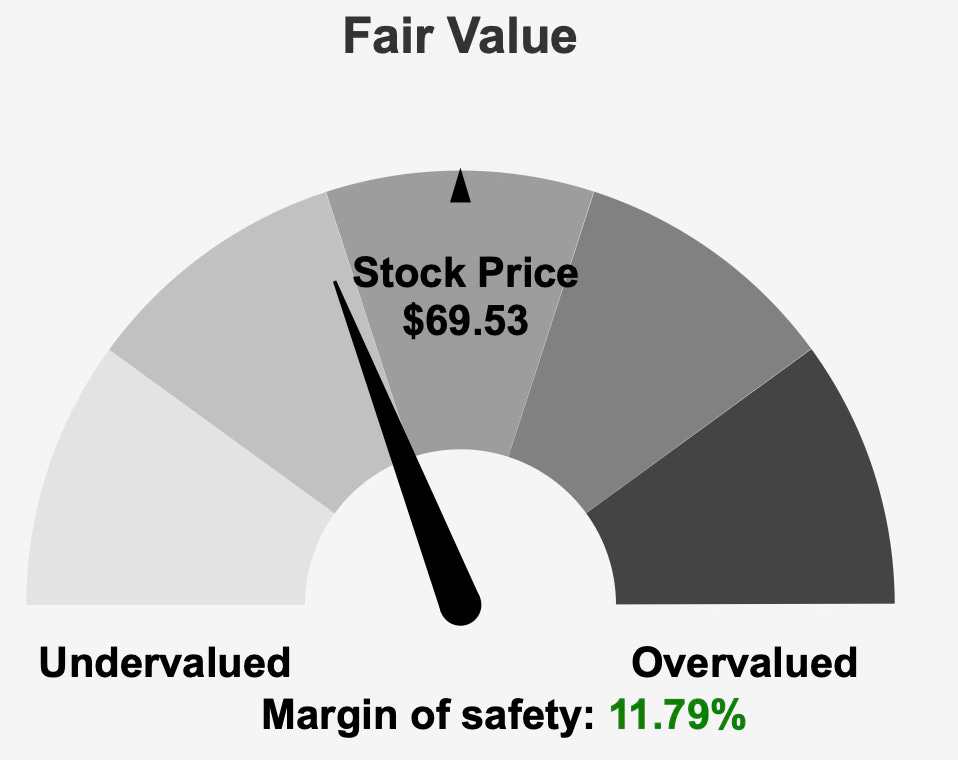
At a current price of $69, the shares trade below an intrinsic value estimate of $78.82, implying an 11.8% margin of safety. The market capitalization stands at $18.66 billion, placing the company firmly in large-cap territory within the consumer packaged goods sector. The stock carries a Buy rating with a low risk designation and is characterized as modestly undervalued.
Growth expectations are steady rather than aggressive. Revenue has compounded at 3.6% over the past five years and 4.6% over ten years. Looking ahead, total revenue is projected to rise from $7,846.12 million in 2026 to $8,443.19 million by 2028. That trajectory aligns with the broader spices and seasonings industry, which is forecast to expand at roughly 4% annually over the next decade. Earnings expectations also reflect incremental improvement, with projected EPS of 3.087 in 2027 and 3.361 in 2028.
For dividend-oriented investors seeking consistency over cyclicality, McCormick offers a blend of global brand durability, mid-single-digit earnings growth, and a starting yield that stands meaningfully above its long-term median. The investment case rests not on rapid expansion, but on compounding resilience supported by disciplined capital allocation.
2. Earnings Momentum & Profitability Trends
Recent quarterly performance reflects modest but tangible earnings improvement. EPS excluding non-recurring items came in at $0.86, up from $0.85 in the prior quarter and $0.80 in the comparable period last year. Diluted EPS held at $0.84 sequentially and improved from $0.80 year over year. Revenue per share rose to $6.869, compared with $6.405 in Q3 2025 and $6.669 in Q4 2024, reinforcing a gradual upward trajectory.
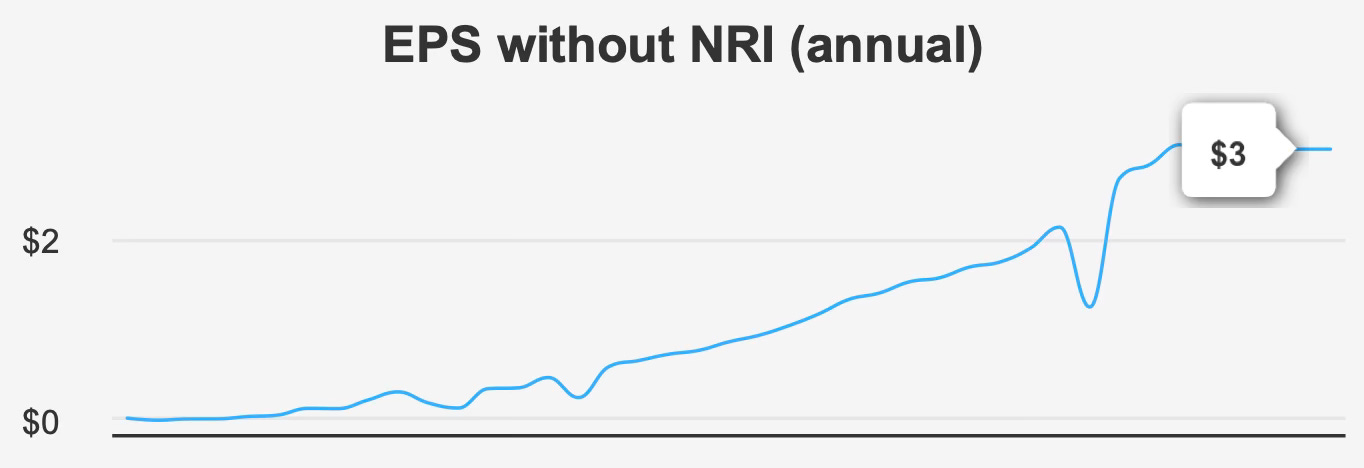
Over a longer horizon, the earnings picture is more nuanced. Five-year annual EPS growth excluding non-recurring items has been subdued at 0.7% compounded, though the ten-year CAGR of 6.4% demonstrates that earnings expansion has historically been stronger when viewed across full cycles. This divergence highlights a period of margin pressure and operating adjustment in the more recent five-year window.
Gross margin currently stands at 37.9%, consistent with its five-year median but below the ten-year median of 39.01%. The compression relative to the longer-term baseline suggests cost pressures or pricing dynamics have constrained profitability in recent years. Indeed, gross margin has declined at an average rate of 1.2% annually over the past five years, while operating margin has contracted by 2.4% per year during the same period.
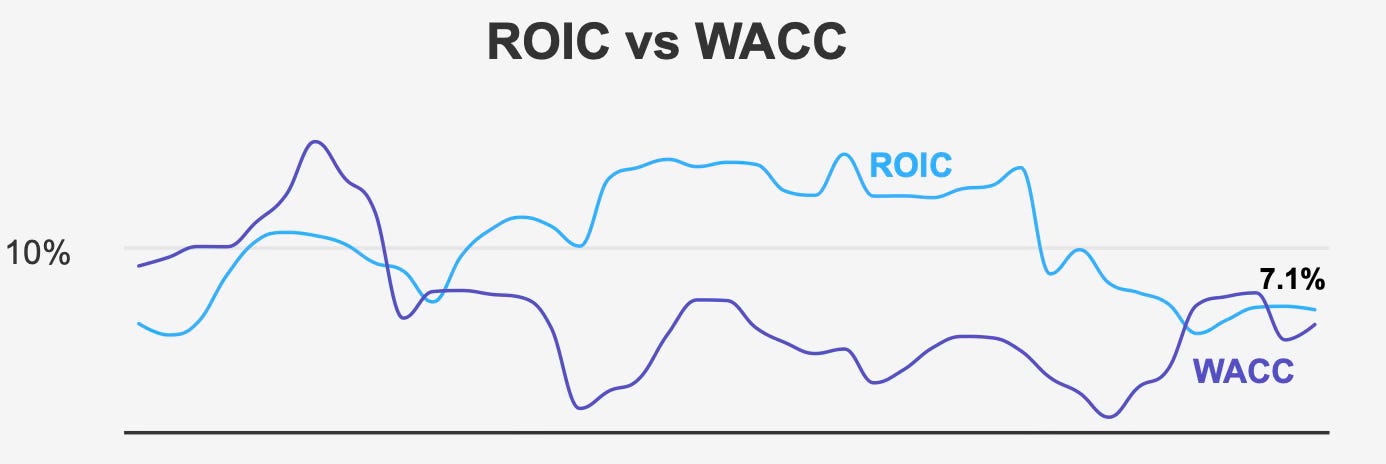
Despite this margin headwind, capital efficiency metrics show improvement in the current environment. The five-year median return on invested capital is 7.21%, slightly below the five-year median weighted average cost of capital of 7.33%. However, the most recent ROIC of 7.1% exceeds the current WACC of 6.38%, indicating that the company is presently generating returns above its cost of capital. That shift back into positive economic spread territory is important for long-term value creation.
Return on equity has fluctuated materially over the past decade, ranging from a high of 32.57% to a low of 13.97%. While variability exists, median levels suggest stable profitability through cycles rather than structural deterioration.
Share repurchase activity has been minimal in the past year, with a buyback ratio of -0.10%, indicating a slight increase in shares outstanding. This is consistent with the five-year trend. Over a ten-year period, however, buybacks have ranged from a high reduction of 7.7% to a low of -2.3%, demonstrating that management has historically used repurchases opportunistically rather than systematically.
In sum, earnings momentum is steady but not accelerating. Margin pressures remain a watchpoint, yet current capital returns exceeding the cost of capital suggest underlying operational stability.
3. Dividend Profile & Sustainability
McCormick’s dividend profile remains one of its most attractive attributes. The forward dividend yield stands at 2.64%, comfortably above the company’s ten-year median yield of 1.74%. For income investors, that higher-than-normal yield reflects both valuation compression and sustained dividend growth.
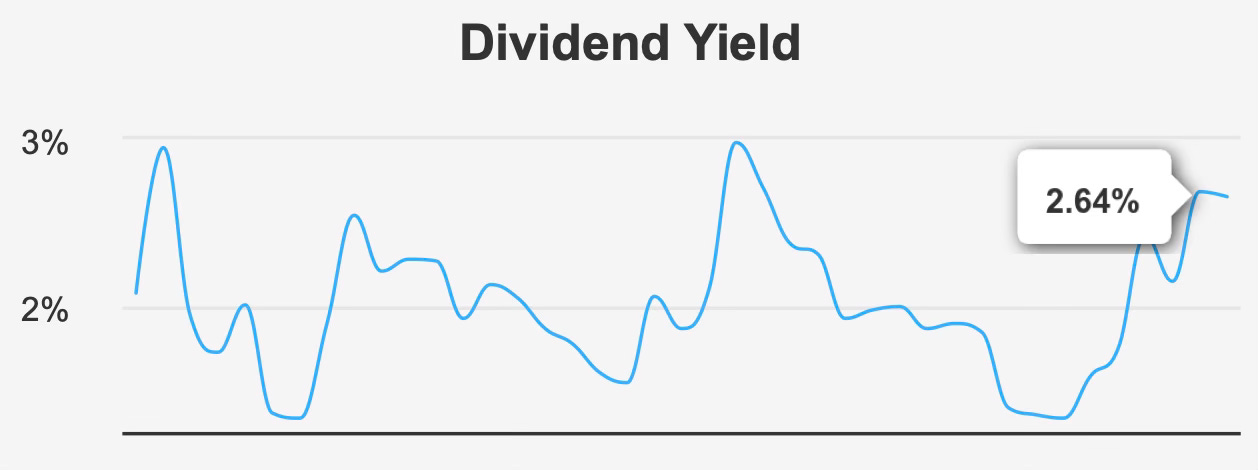
The most recent quarterly dividend increased from $0.45 to $0.48 per share, reinforcing management’s commitment to incremental annual raises. Over the past five years, the dividend has grown at a 7.6% compounded rate, while the three-year growth rate sits at 6.7%. Looking ahead, estimated dividend growth of 6.19% over the next three to five years aligns closely with historical patterns, suggesting continuity rather than expansion.
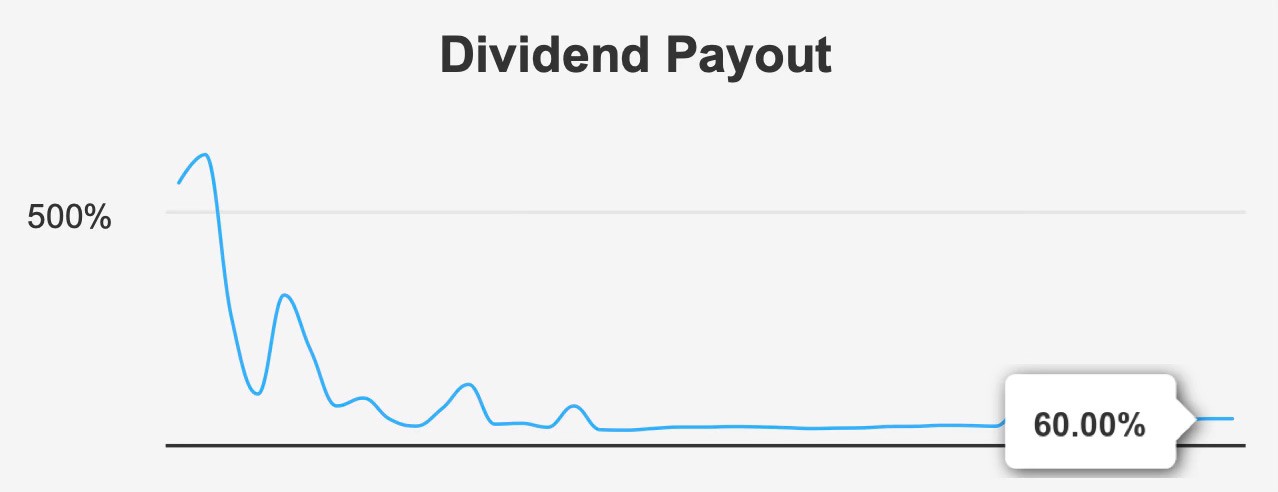
The payout ratio is 60.0%, a level that balances shareholder returns with retained earnings for reinvestment. Dividend coverage stands at 1.63x, indicating that earnings provide a reasonable cushion above current distributions. This structure leaves room for continued mid-single-digit increases without requiring aggressive earnings acceleration.
Leverage remains moderate. The debt-to-EBITDA ratio of 3.11 suggests manageable financial leverage within sector norms. While not conservative in absolute terms, it does not imply strain, particularly given the predictability of the company’s cash flows. The Altman Z-score of 2.62 places the company in the “grey zone,” signaling some financial caution but no imminent distress risk.
The next ex-dividend date is December 29, 2025, with payment scheduled for January 12, 2026. Given its quarterly distribution cadence, the subsequent ex-dividend date is projected for March 27, 2026.
Taken together, McCormick’s dividend appears sustainable, supported by moderate leverage, consistent free cash generation, and a payout ratio that remains well below historical extremes. The investment appeal lies less in high yield and more in the durability of compounding growth.
4. Valuation Analysis: Discount to Intrinsic Value with Multiples Below Historical Medians
At $69.53, the shares trade at a forward P/E of 22.4x, modestly below the trailing P/E of 23.7x. The slight compression reflects expectations of incremental earnings growth. Over the past decade, the P/E ratio has ranged from 16.0x to 37.3x, with a median of 28.6x. Relative to that historical midpoint, today’s multiple appears restrained.
On an enterprise basis, the trailing EV/EBITDA multiple is 17.0x, well below the ten-year median of 21.9x. This suggests valuation normalization potential should operating performance stabilize and margins recover.
The trailing price-to-sales ratio of 2.74x sits near its ten-year low of 2.39x, indicating that the market is assigning a conservative revenue multiple relative to history. Similarly, the price-to-book ratio of 3.25x remains materially below its ten-year median of 5.30x, though above the decade low of 2.84x.
These valuation metrics collectively support the intrinsic value estimate of $78.82 and the 11.8% implied margin of safety. While not deeply discounted, the stock appears priced below historical norms across several measures, providing asymmetry for long-term investors.
Analyst sentiment is cautiously constructive, with average price targets slightly above the current price. Although recent downward revisions suggest tempered near-term expectations, the combination of below-median multiples and steady earnings growth supports a balanced upside case.
5. Risk Assessment & Capital Structure Considerations
The principal operational risk centers on margin compression. The five-year annual decline in gross margin of 1.2% and operating margin contraction of 2.4% indicate that cost pressures or pricing limitations have weighed on profitability. Sustained input inflation or competitive pricing dynamics could prolong this trend.
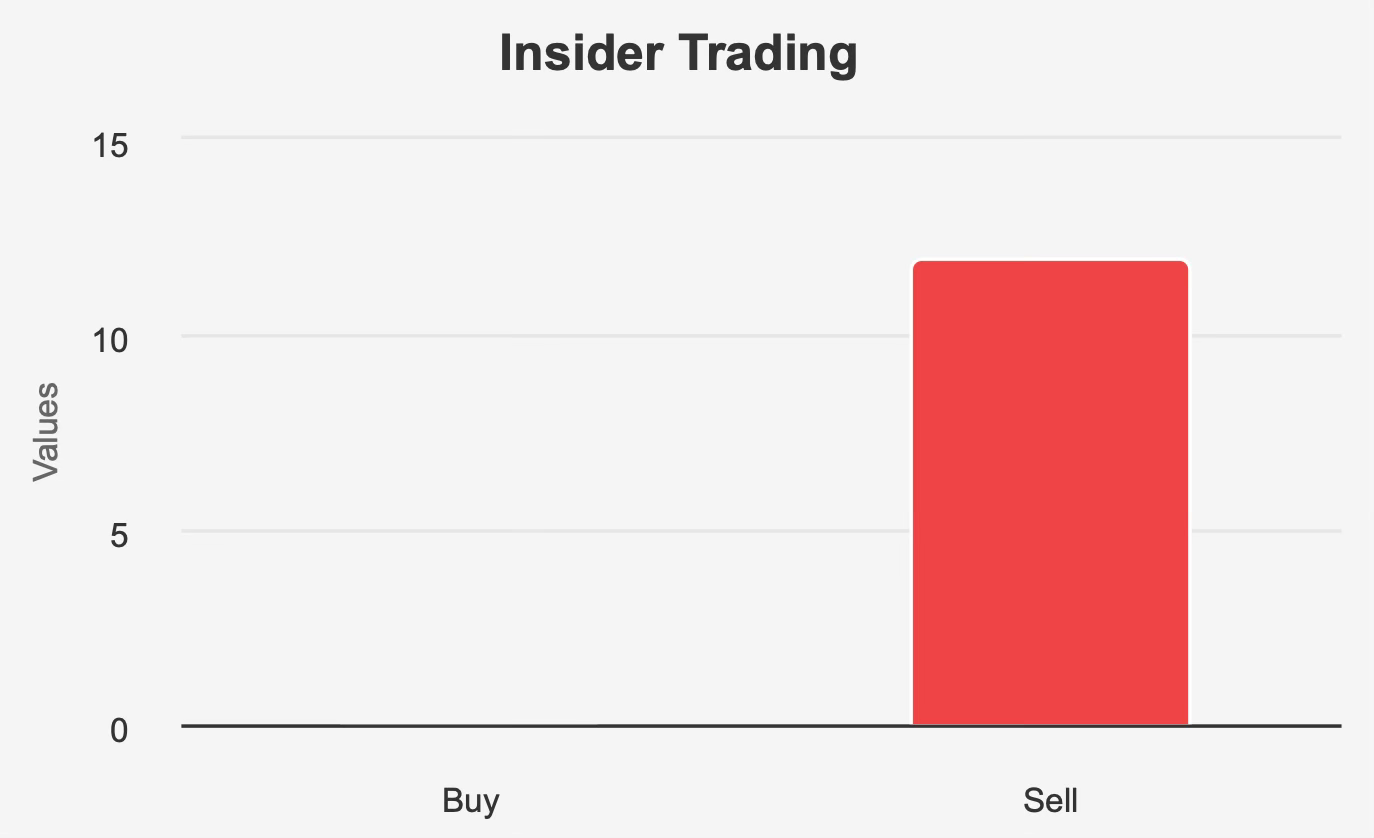
Insider activity also warrants attention. Over the past 12 months, insiders executed 12 sell transactions, including five within the last three months, with no recorded purchases. Insider ownership stands at 0.23%, relatively low by governance standards. In contrast, institutional ownership is high at 83.24%, indicating significant participation by large asset managers.
While insider selling can occur for many reasons unrelated to fundamentals, the absence of purchases suggests limited signaling confidence at current levels.
Financial risk appears contained. The Beneish M-score of -2.44 indicates a low probability of earnings manipulation, providing reassurance regarding financial statement integrity. Government contract revenue has increased from $10 million in 2019 to $25 million in 2022, reflecting expanding institutional relationships. Patent activity rose from one patent in 2020 to eight in 2023 before projected moderation, signaling periods of focused innovation.
Liquidity is generally solid, with an average daily trading volume of approximately 4.0 million shares over the past two months. Recent daily volume of 2.97 million shares suggests short-term variation rather than structural illiquidity. A Dark Pool Index of 33.82% indicates that roughly one-third of trading occurs off-exchange, typical for a widely held institutional name.
Overall, leverage, liquidity, and governance metrics point to manageable structural risk. The more meaningful variable remains operating margin stabilization.
Final Assessment
McCormick represents a classic defensive compounder operating within a resilient consumer category. Revenue growth in the 4–5% range, projected earnings expansion into the mid-single digits, and dividend growth near 6–8% collectively form the foundation of its long-term appeal.
The stock currently trades at valuation multiples below historical medians, including a forward P/E of 22.4x versus a ten-year median of 28.6x and an EV/EBITDA of 17.0x versus 21.9x historically. Combined with an intrinsic value estimate of $78.82 and an 11.8% margin of safety, the valuation case is constructive though not extreme.
Risks center on margin compression and insider selling patterns, but capital returns exceeding the cost of capital and a sustainable 60.0% payout ratio support ongoing dividend growth. With a forward yield of 2.76% above its long-term median, investors are being compensated to wait for normalization.
For long-term dividend investors seeking stability, modest growth, and valuation support, McCormick offers a balanced total return profile anchored by brand durability and disciplined financial management.