
Innovative Industrial Properties: Yield at a Cost
Evaluating the sustainability of Innovative Industrial Properties’ 16% dividend

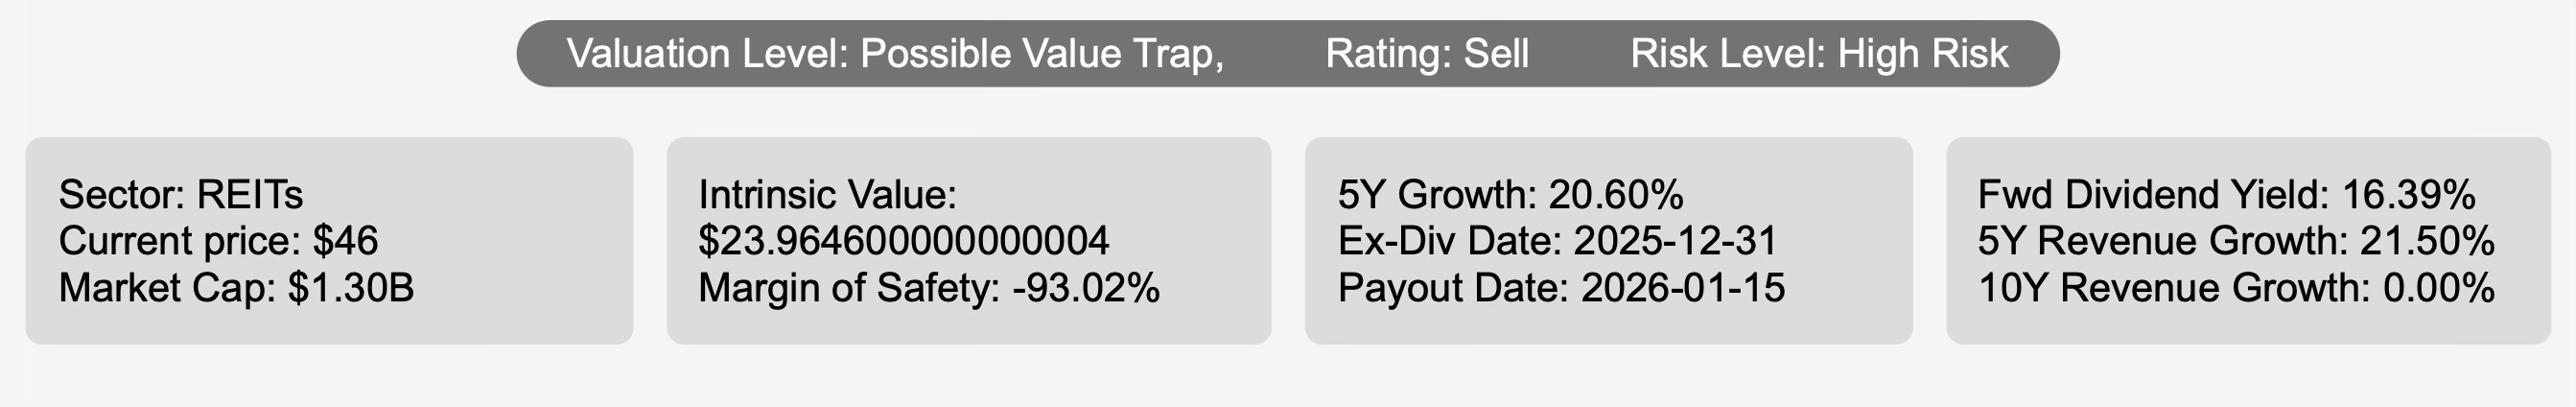
Investment Thesis: A High-Yield REIT Where Income Masks Deteriorating Economics
Innovative Industrial Properties IIPR 0.00%↑ operates as a specialized real estate investment trust focused on acquiring and leasing industrial facilities used for regulated medical cannabis operations across the United States. The niche positioning initially allowed the company to generate exceptional growth, as traditional financing channels were largely unavailable to tenants operating within a federally restricted industry. That structural advantage drove strong expansion in revenue and earnings during its earlier years, helping establish a reputation as a growth-oriented income REIT.
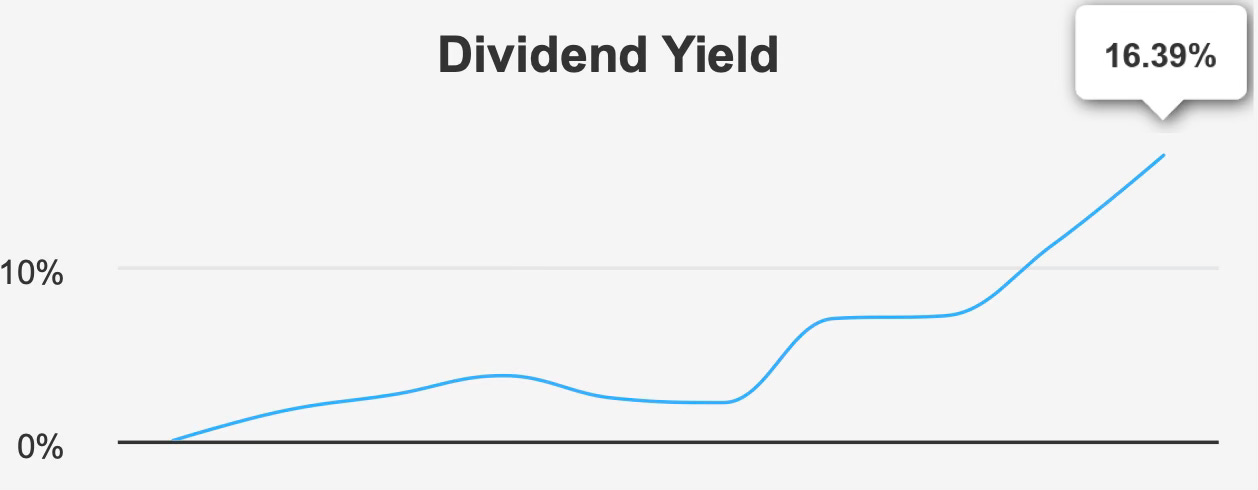
However, the investment case today is materially different from the one that historically justified premium growth expectations. The company now presents a combination of very high yield and weakening underlying economics. While a forward dividend yield of 16.4% appears attractive on the surface, the financial profile supporting that yield has become strained.
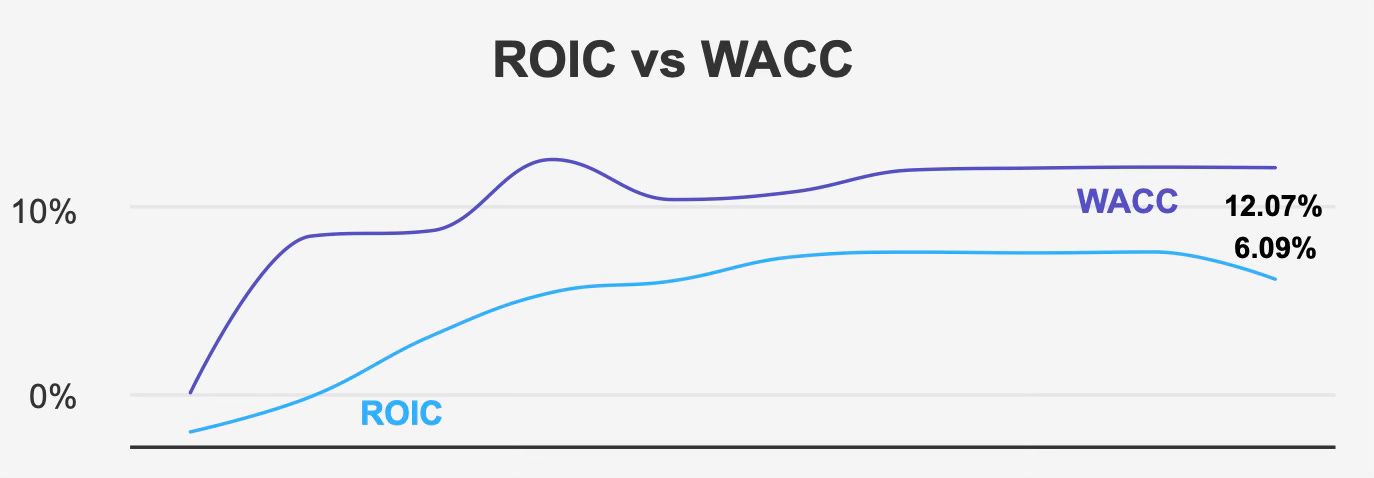
At the core of the issue is capital efficiency. Over the past five years the company generated a median return on invested capital of 7.5% against a median cost of capital of 12.0%. Currently the spread remains negative, with ROIC at 6.1% compared with a 12.1% weighted average cost of capital. This means incremental investments have destroyed economic value rather than creating it. For a REIT whose business model depends heavily on raising capital and reinvesting it into properties, persistent negative value creation undermines the long-term sustainability of both growth and dividends.
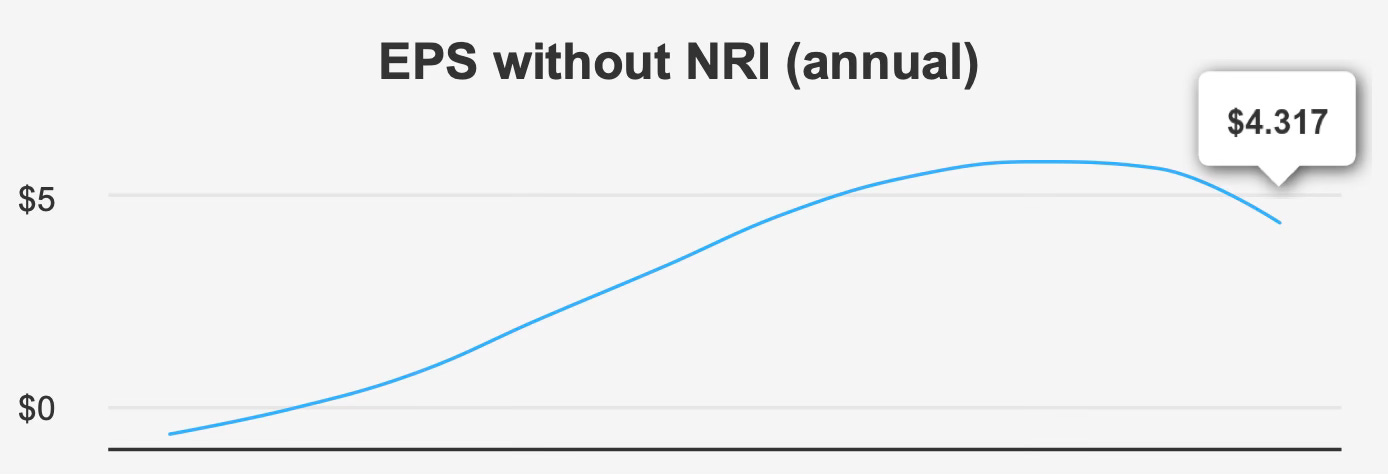
Growth itself has also moderated. The company delivered a strong historical expansion profile, including approximately 22% annualized EPS growth over five years and 21.5% revenue growth, but more recent performance reflects volatility. Quarterly earnings per share declined year over year from $1.37 to $0.97 despite a sequential improvement from $0.86 in the prior quarter. Analysts still expect modest forward growth, with projected EPS of $3.95 in 2026 and $4.11 in 2027, yet these expectations are significantly slower than the company’s earlier expansion phase.
The combination of slowing growth, declining margins, and value-destructive capital deployment contrasts sharply with the market narrative implied by the high dividend yield. Rather than representing a stable income opportunity, the yield increasingly resembles compensation for elevated risk.
2. Earnings Momentum & Profitability Trends
Recent operating performance reflects a transition from rapid expansion toward a more constrained profitability environment. Quarterly revenue per share increased slightly to $2.285 from $2.221, but this modest improvement does not offset the broader deterioration in margins and earnings stability.
Gross margin declined to 89.2% in the most recent quarter, materially below the five-year median of 95.8% and far from the historical high of 98.2%. Such a decline is meaningful for a property-leasing REIT because margins historically remain stable when tenant credit quality and lease economics are strong. The erosion therefore suggests either tenant stress, renegotiated lease terms, higher operating costs, or reduced pricing power in the cannabis real estate market.
Although the company repurchased roughly 1.1% of shares during the last year, its long-term buyback ratio remains negative, indicating that dilution has historically outweighed repurchases. For investors evaluating per-share growth sustainability, this matters because REIT expansion has relied more on capital issuance than internally generated cash flows.
The broader measure of profitability—economic value creation—presents the clearest concern. Persistent ROIC below WACC indicates the firm’s property acquisitions are not generating sufficient returns relative to financing costs. This dynamic often leads to a gradual deterioration in balance sheet flexibility and eventually forces either slower growth or dividend adjustment.
Despite these pressures, the company still benefits from industry demand tailwinds. The regulated cannabis sector continues expanding geographically, supporting occupancy demand. Yet sector growth alone cannot offset weak capital allocation economics indefinitely. A business can grow revenue while simultaneously eroding shareholder value, and the current financial profile suggests precisely that dynamic.
3. Dividend Profile & Sustainability
The dividend is the central reason investors consider this company, yet it is also the largest source of risk.
The forward yield of 16.4% ranks near historical highs and far exceeds traditional REIT income levels. Over the past five years, dividends increased at a strong 20.6% annual rate, demonstrating management’s prior commitment to returning capital. However, more recent growth slowed to 9.5% over three years, and projections imply no dividend growth over the next three to five years.
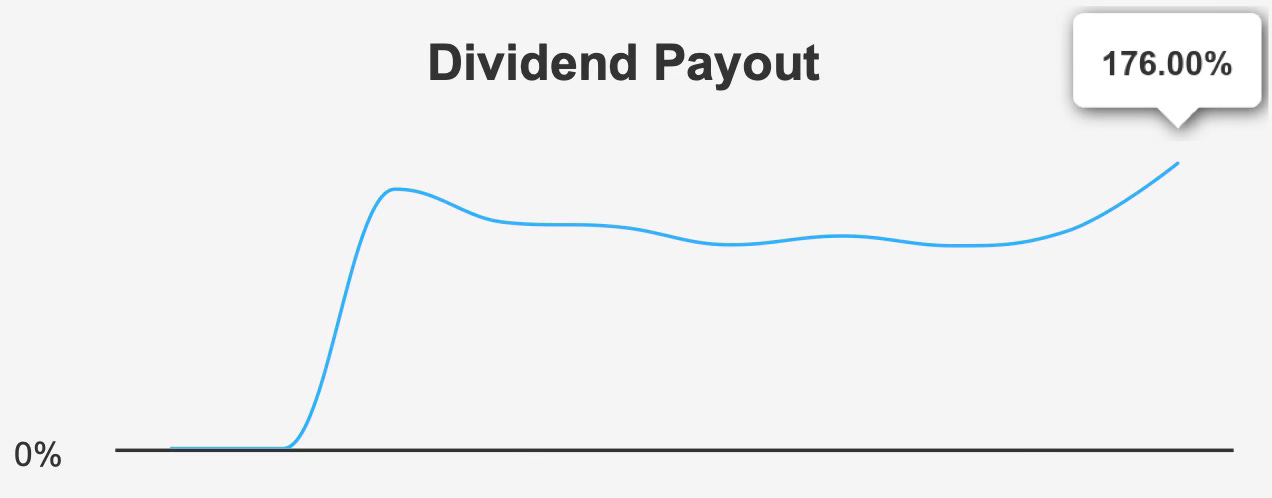
More concerning than growth is coverage. The payout ratio stands at 176%, meaning the company distributes substantially more cash than it earns. Dividend coverage is only 0.56, reinforcing that distributions rely on external capital, asset sales, or balance sheet flexibility rather than recurring profitability.
REITs can temporarily sustain elevated payout ratios because of depreciation accounting differences, but persistent coverage below earnings and below economic returns eventually forces adjustment. The negative ROIC-WACC spread compounds this risk because new investments do not improve coverage.
On the positive side, leverage remains moderate. A debt-to-EBITDA ratio of 1.57 indicates strong capacity to service obligations, suggesting the dividend is not immediately threatened by excessive borrowing costs. Yet balance sheet strength alone cannot support a structurally uncovered dividend indefinitely.
The likely outcome is not necessarily an immediate reduction but rather a stagnating distribution followed by adjustment if operating conditions fail to improve. The absence of expected dividend growth itself signals management caution.
For income investors, the key takeaway is that the yield should not be interpreted as stable income comparable to traditional net-lease REITs. Instead, it functions as a risk premium reflecting uncertainty around tenant stability and capital efficiency.
4. Valuation: Statistical Cheapness Versus Fundamental Value
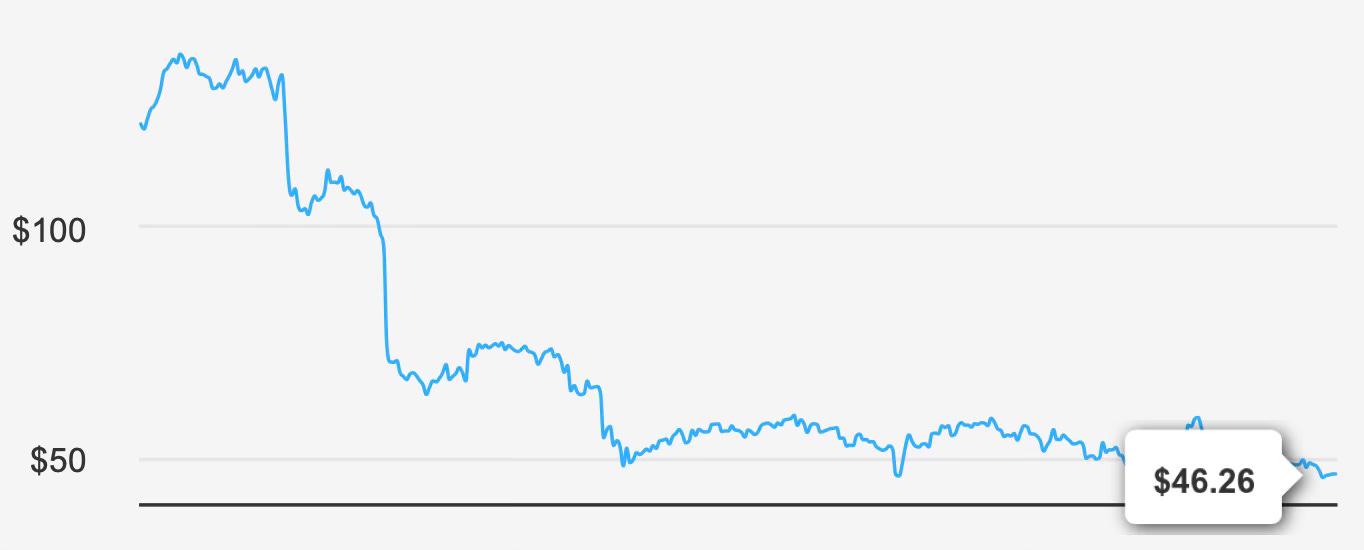
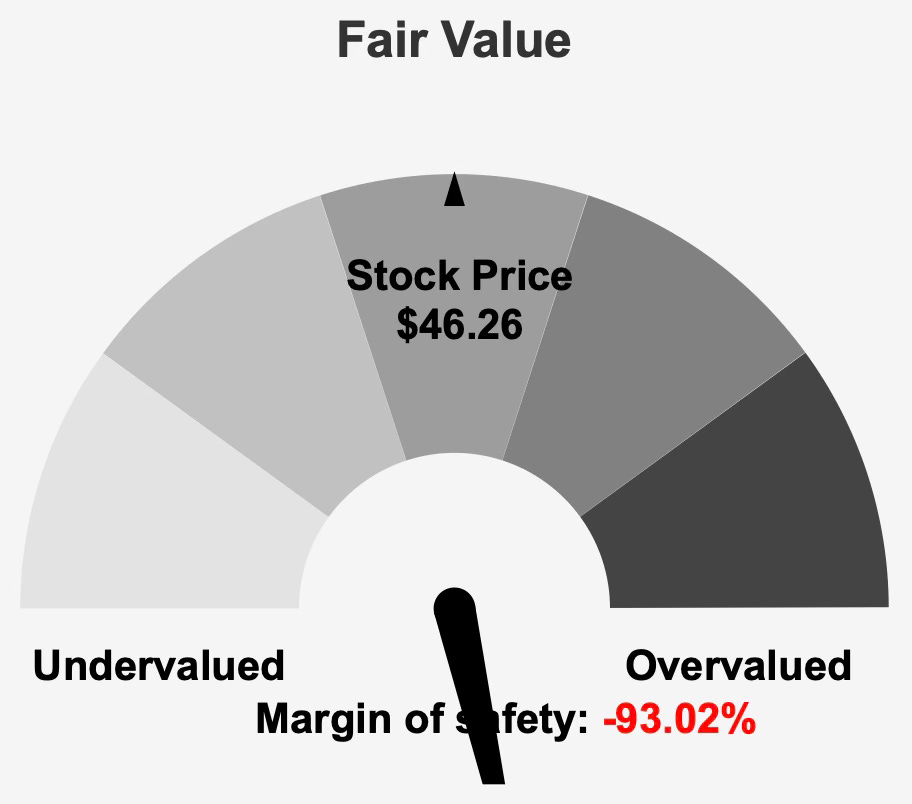
At a market price near $46, valuation appears superficially attractive across several traditional multiples. The stock trades at approximately 11.0x trailing earnings and 11.3x forward earnings, well below its historical median multiple of 32.0x. Enterprise value to EBITDA stands at 7.6x compared with a long-term median of 16.9x, and price to free cash flow of 6.4x also approaches historical lows. The price-to-book ratio of 0.71 suggests the market values the company below its recorded asset value.
Viewed in isolation, these metrics might indicate an undervalued REIT poised for re-rating.
However, intrinsic valuation tells a different story. The estimated intrinsic value is roughly $24, implying a large negative margin of safety relative to the current price. The discrepancy highlights an important distinction: the market is not discounting a stable cash-flow stream but rather pricing uncertainty in long-term earnings durability.
Low multiples alone do not confirm value if earnings quality is deteriorating. In this case, declining margins, uncovered dividends, and negative economic returns justify a compressed valuation range. The market may be pricing the possibility that future earnings will be lower than historical levels, meaning current multiples are not necessarily cheap relative to normalized profitability.
This dynamic often occurs in high-yield equities. As risk rises, investors focus on income rather than fundamentals, temporarily supporting prices despite weakening intrinsic value. The apparent undervaluation based on historical multiples may therefore represent structural repricing rather than opportunity.
The modest analyst price target near $57 suggests limited upside even under favorable assumptions. When upside potential is moderate but downside risk is tied to dividend sustainability, the risk-reward profile becomes asymmetric.
5. Risk Assessment & Capital Structure Considerations
The company presents a complex risk profile combining operational, financial, and structural concerns.
The Altman Z-score of 1.77 indicates potential financial distress within two years under adverse conditions. While not a prediction of bankruptcy, it signals vulnerability to declining tenant performance or capital market tightening. The Beneish M-score of 2.13 also raises concerns about earnings quality, reinforcing the need for careful scrutiny of reported results.
Operationally, declining gross margins and lower revenue per share over the past year suggest weakening tenant economics or renegotiated lease terms. Because the company operates in a single specialized industry, tenant diversification risk is higher than for diversified REITs. Industry-specific regulatory changes could materially affect occupancy and rent collections.
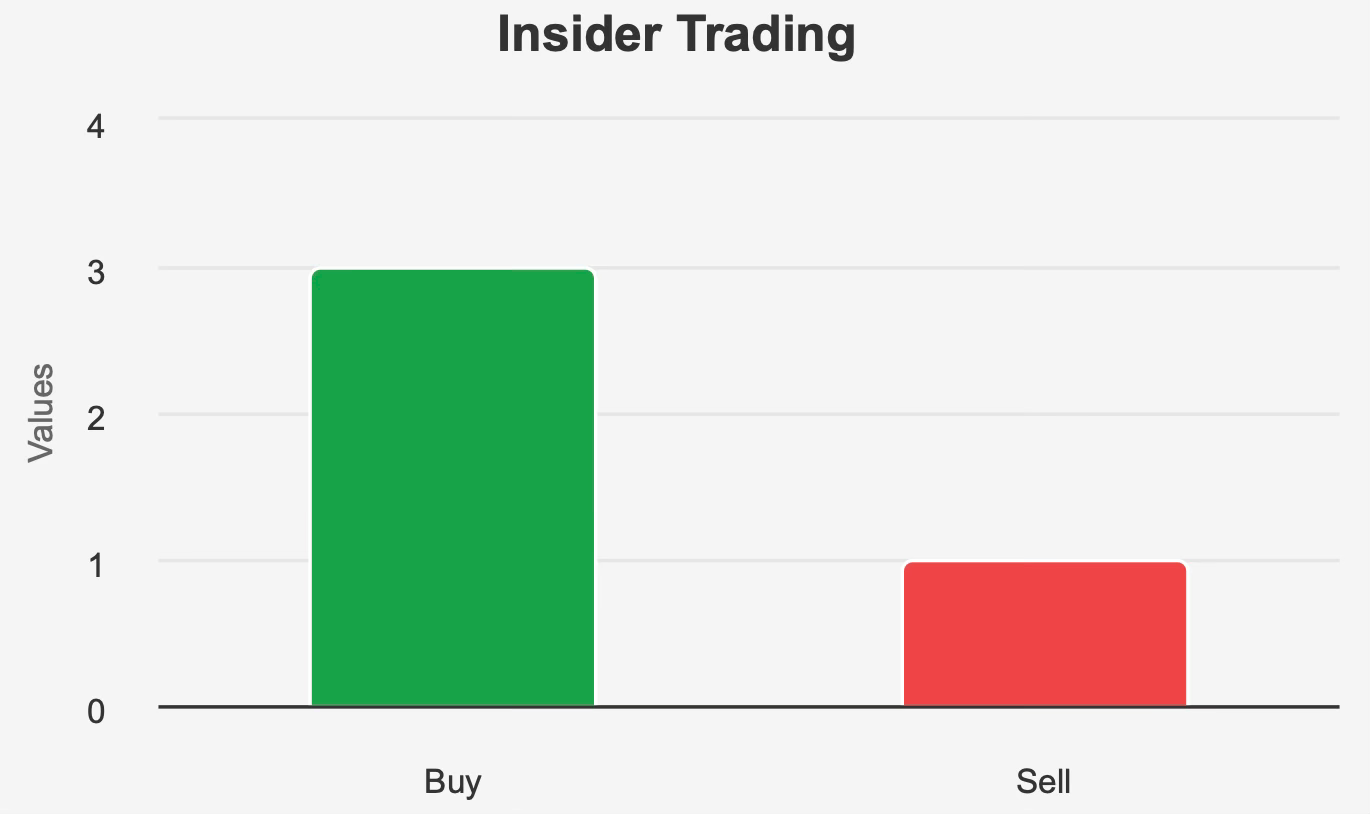
Liquidity remains adequate, though trading volume recently fell below its two-month average. Institutional ownership of 67.2% provides some market stability, but insider ownership of 1.85% is relatively modest, limiting alignment incentives. Recent insider purchases totaling 2,600 shares provide a mildly positive signal but are too small to materially offset broader financial concerns.
The balance sheet itself is not heavily leveraged, which delays potential financial distress. However, the core risk lies not in excessive debt but in capital allocation economics. A company earning less than its cost of capital eventually erodes equity value regardless of leverage level.
Final Assessment
Innovative Industrial Properties represents a textbook case of a high-yield equity where income attractiveness masks deteriorating economic fundamentals.
Historically, the company benefited from a unique financing niche that produced exceptional growth. Today that advantage has weakened, and the financial profile reflects slower expansion, declining margins, and negative value creation. The dividend remains the primary attraction, yet its coverage ratio indicates reliance on external funding rather than sustainable operating income.
Valuation metrics appear inexpensive relative to historical levels, but intrinsic value estimates and capital efficiency metrics suggest the discount is justified. Investors are not being offered a bargain so much as compensation for elevated uncertainty.
The moderate leverage position reduces near-term insolvency risk, yet the combination of uncovered dividends and ROIC below WACC creates long-term pressure. Unless profitability improves materially, the dividend will likely stagnate and may eventually require adjustment.
For long-term income investors prioritizing reliability over yield, the risk-reward balance is unfavorable. The current yield is high precisely because its durability is uncertain.
The stock therefore fits better into a speculative yield category rather than a dependable dividend compounder. Income-focused portfolios seeking stable distributions should treat the yield cautiously, recognizing that exceptionally high yields rarely persist without corresponding risk.