
ExxonMobil: Durable Cash Flows, Expensive Entry Point
A comprehensive dividend analysis of ExxonMobil’s sustainability versus valuation risk

Investment Thesis: A High-Quality Cash-Generating Energy Franchise Trading Beyond Its Economic Worth
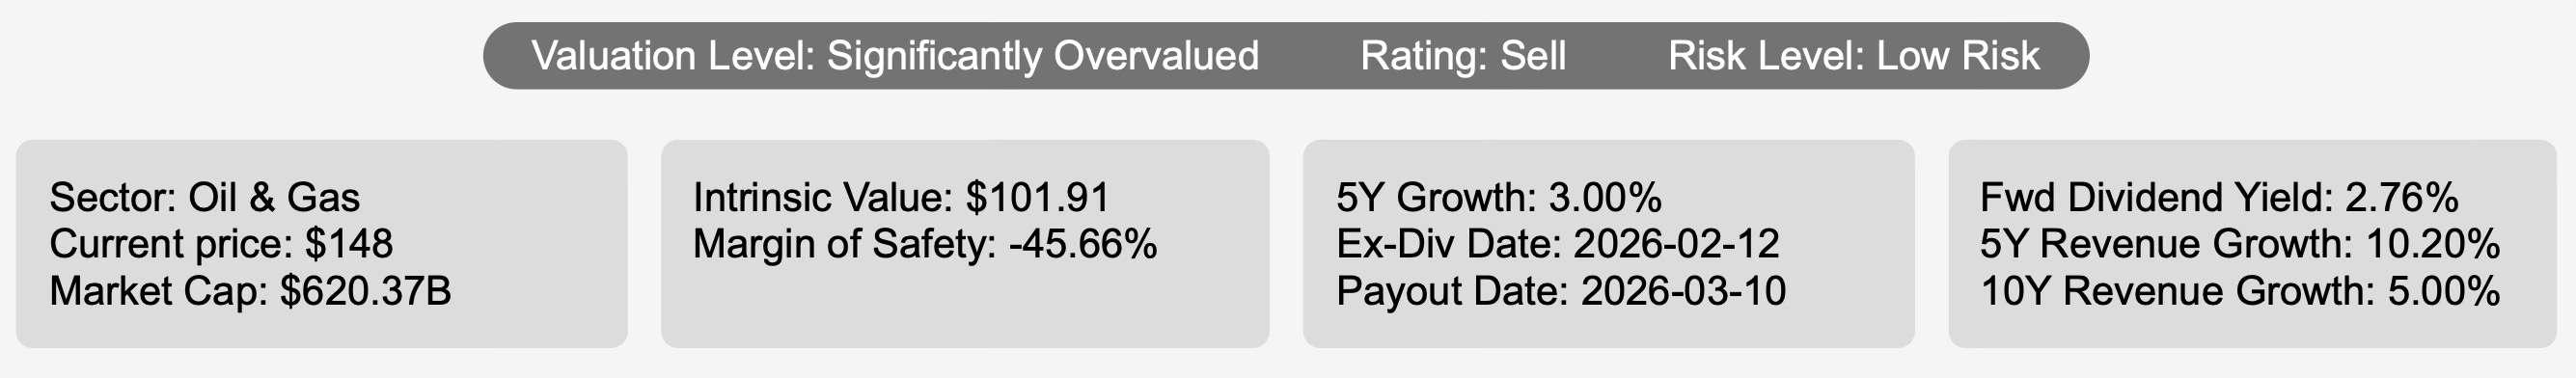
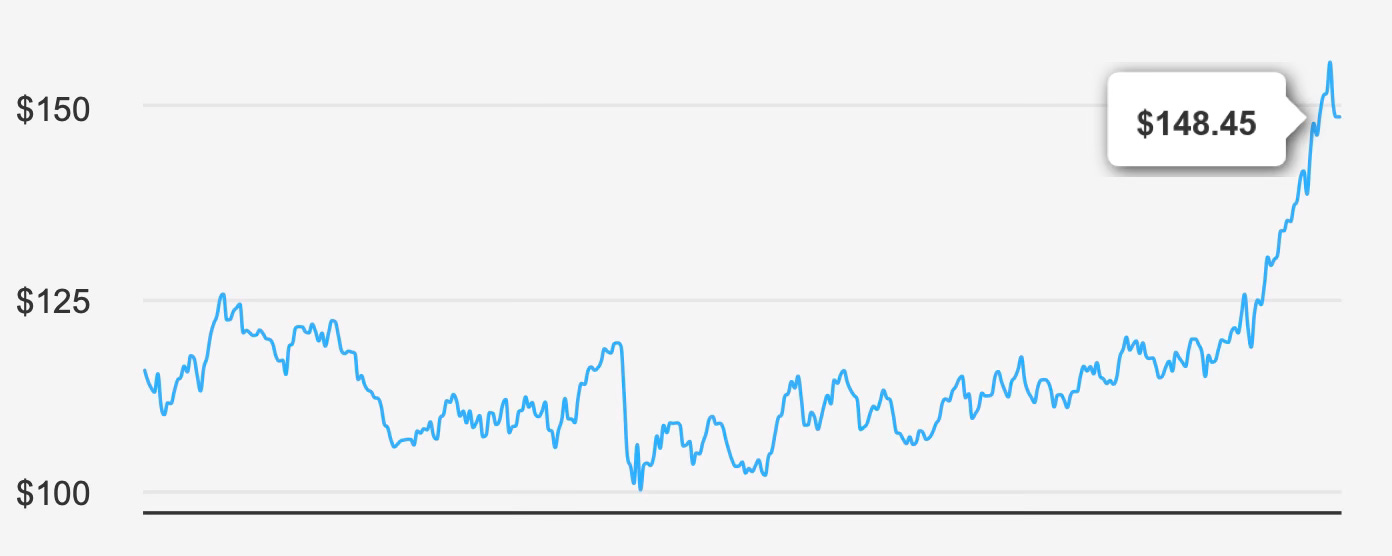
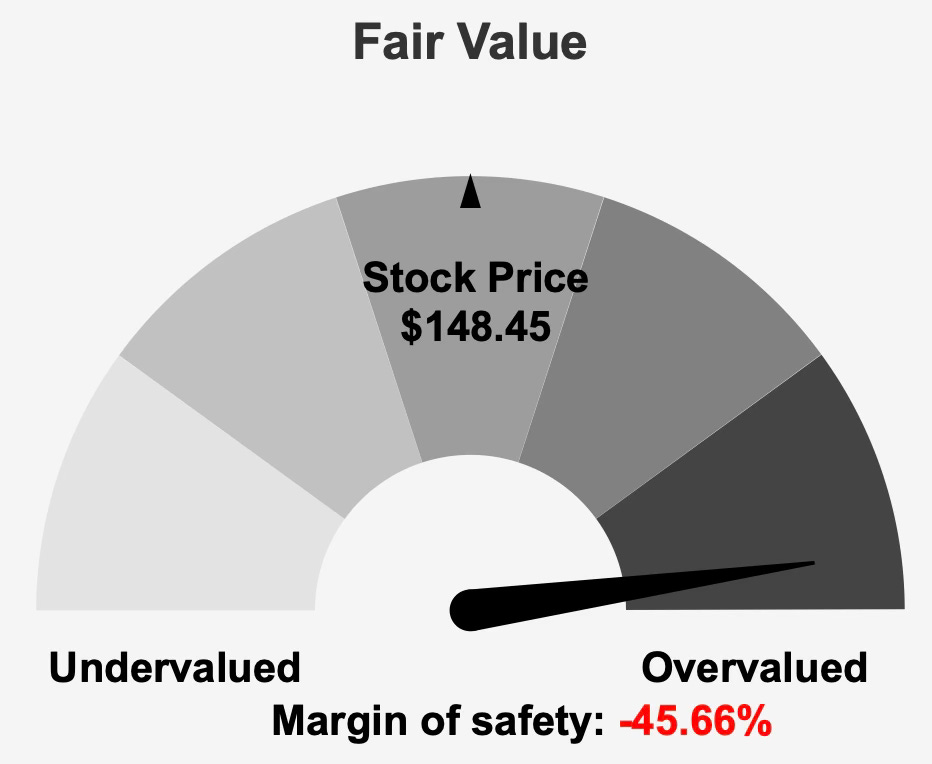
Exxon Mobil Corporation XOM 0.00%↑ currently trades at approximately $148 per share while its estimated intrinsic value stands near $101.9, implying a negative margin of safety of roughly 45.7%.
This gap defines the central investment debate. ExxonMobil remains one of the strongest integrated oil and gas franchises globally, yet the share price embeds optimism inconsistent with its long-term growth profile.
The company produces about 3.3 million barrels of liquids per day and 8.4 billion cubic feet of natural gas daily, supported by 19.9 billion barrels of oil equivalent reserves, nearly 69% liquids. Its refining network processes roughly 4.3 million barrels per day, complemented by a large chemicals operation.
Operational scale gives ExxonMobil resilience across commodity cycles. Integrated majors historically rely less on volume growth and more on capital discipline and margin control. That framework explains why the investment case for ExxonMobil centers on durability rather than expansion.
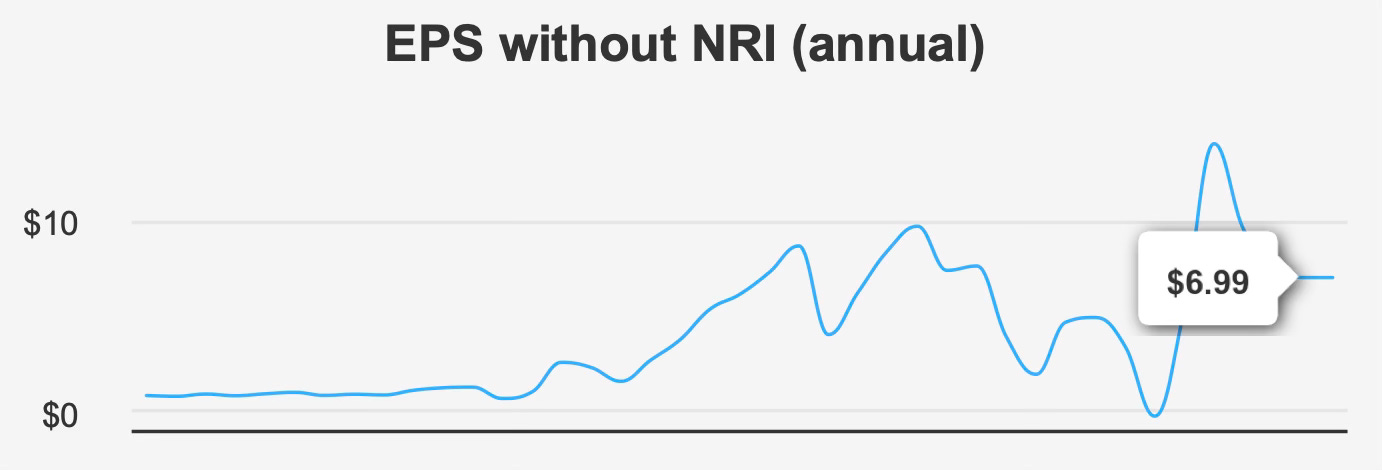
However, long-term earnings growth has been limited. Over the past five and ten years, EPS excluding non-recurring items has been largely stagnant. Industry forecasts reinforce this reality, projecting only about 3–4% annual sector growth over the next decade.
This places ExxonMobil in a mature-cash-generator category rather than a compounding growth story.
The stock therefore functions primarily as an income and stability instrument — not a growth investment. Yet the valuation currently resembles a moderate growth company rather than a low-growth cash distributor.
The mismatch between business characteristics and pricing drives the core thesis: ExxonMobil is fundamentally strong but priced for more than it structurally delivers.
2. Earnings Momentum & Profitability Trends
ExxonMobil’s most recent quarterly performance highlights steady but unspectacular earnings dynamics. Fourth-quarter EPS excluding non-recurring items reached $1.71, improving from $1.67 a year earlier but declining from $1.88 in the prior quarter.
Diluted EPS came in at $1.53, slightly below last year’s $1.72.
Revenue per share was $18.84, nearly unchanged year over year but lower sequentially. The pattern is typical for a commodity-linked enterprise: performance fluctuates with pricing rather than steadily compounding.
Profitability shows mild pressure. Gross margin sits near 22.0%, below the 5-year median of 23.5% and well below the historical peak of 25.9%.
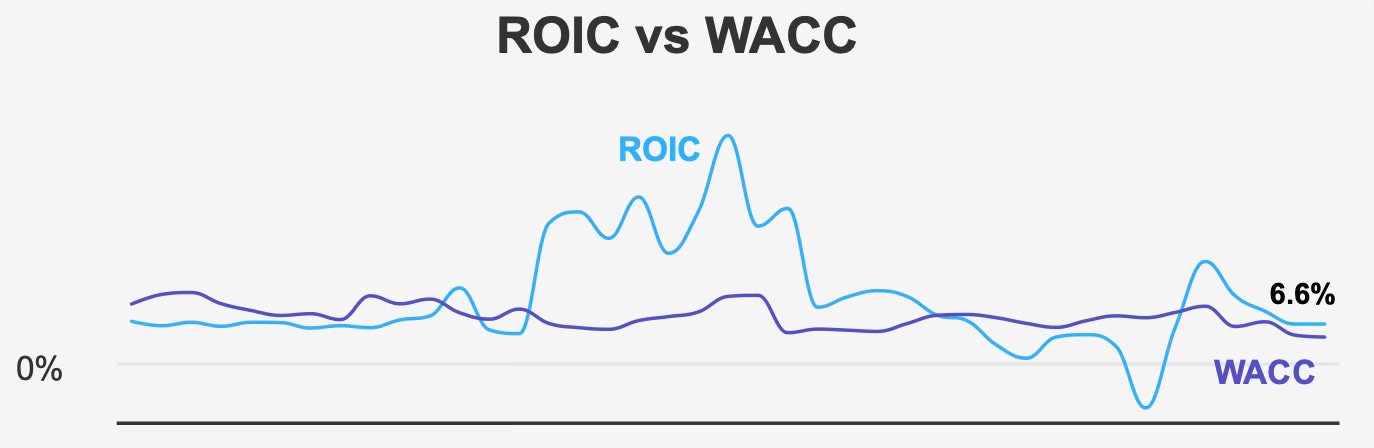
Despite margin compression, capital efficiency remains positive. ExxonMobil’s median return on invested capital over five years is about 8.8%, exceeding its 7.0% weighted average cost of capital. The current spread persists as ROIC remains near 6.6% versus a WACC around 4.4%.
The significance is not growth — it is economic profitability. ExxonMobil still creates value above its capital cost, but the spread is moderate rather than exceptional. This is consistent with a stable industrial franchise rather than a compounding platform.
Share repurchases also illustrate mixed capital allocation signals. The company reduced share count by roughly 4% in the last year, yet over three years net issuance totaled about 0.8%.
Forward expectations call for gradual improvement. Analysts estimate revenue around $318.1 billion next year, with EPS rising to approximately $7.1 and then $8.6 the following year.
Even if realized, this trajectory still aligns with mid-single-digit normalized growth — not rapid expansion. The business is economically solid but structurally mature.
3. Dividend Profile & Sustainability
The dividend remains the primary reason investors own ExxonMobil.
The quarterly dividend recently increased from $0.99 to $1.03 per share. Over three years, dividend growth averaged about 4.1%, slightly above the five-year rate of 3.0%.
Forward yield currently stands near 2.7%, below the historical median of 3.7%.
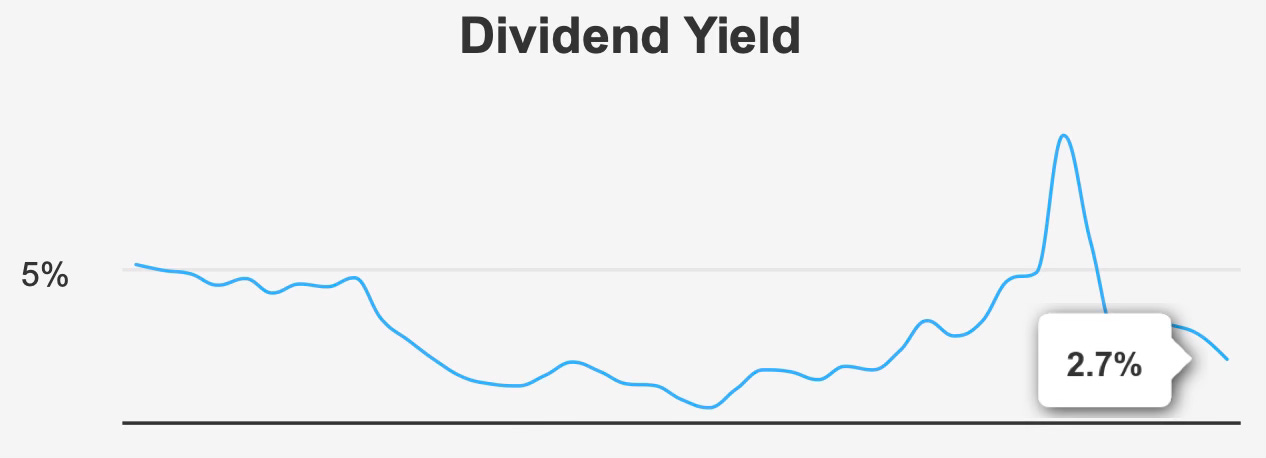
This lower yield is not the result of a weaker payout — it reflects a higher share price.
The payout ratio is roughly 57%, markedly improved from historical periods exceeding 100%. Dividend coverage sits around 1.67x.
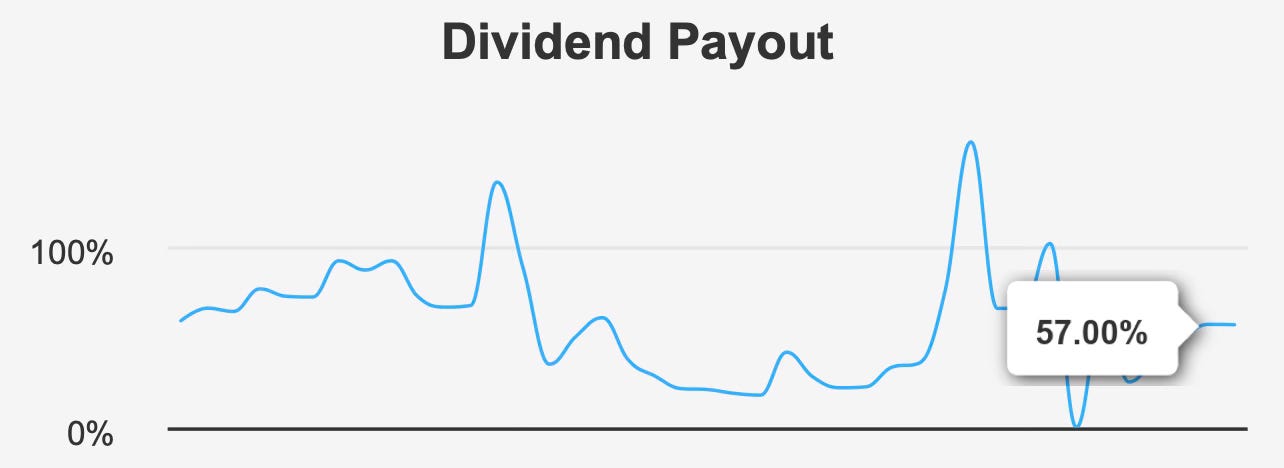
These figures imply a balanced policy. ExxonMobil is no longer stretching cash flows to maintain dividend status; it is funding distributions within earnings capacity.
Financial leverage reinforces sustainability. Debt-to-EBITDA is approximately 0.64, comfortably below common risk thresholds. The Altman Z-score of 4.62 and Beneish M-score of −2.81 further indicate financial stability and low manipulation risk.
Future dividend growth is projected around 4% annually.
Put differently, investors should expect inflation-like income growth rather than income acceleration.
The dividend appears highly secure but modestly growing — consistent with a mature commodity business.
4. Valuation: Market Pricing Reflects Optimism Beyond Fundamental Growth Prospects
ExxonMobil’s valuation metrics consistently sit above historical norms.
The forward P/E ratio is about 21.7x versus a 10-year median near 16.3x. EV/EBITDA stands close to 9.7x compared with a long-term average around 7.8x.
Price-to-sales is roughly 2.0x, near decade highs, while price-to-book around 2.4x also approaches peak historical levels.
Free-cash-flow valuation follows the same pattern. The P/FCF multiple near 27.2x exceeds its historical median of about 20.5x.
Across metrics, the conclusion is consistent: the stock trades at a premium relative to its own history despite slow growth.
Analyst targets near $140 also imply limited upside from current levels.
Because ExxonMobil is not a high-growth company, valuation compression historically represents the primary downside risk. When commodity cycles normalize, multiples often revert rather than expand.
The dividend yield being near a decade low reinforces this interpretation. Investors are paying more per dollar of income than usual.
The valuation therefore reflects confidence in stability rather than an attractive entry point.
5. Risk Assessment & Capital Structure Considerations
The balance sheet remains a core strength.
Low leverage and strong liquidity provide resilience during commodity downturns. The company also maintains substantial institutional ownership near 65.7%, suggesting long-term capital participation.
However, valuation risk dominates operational risk.
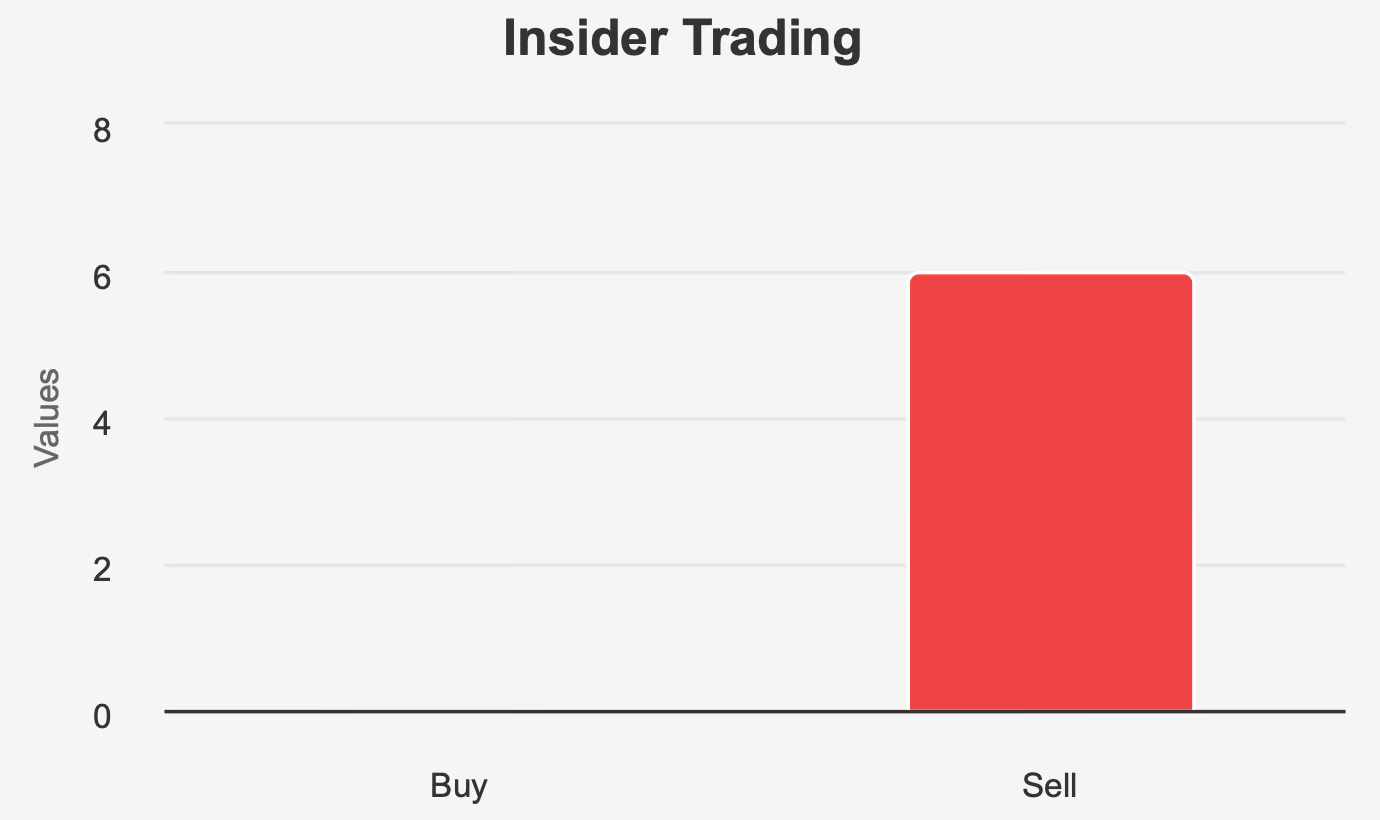
Shares trade near decade highs, and insider transactions show consistent selling without purchases over the past year. While insider ownership is small at 0.86%, persistent selling often signals limited perceived upside.
Revenue per share has declined over the past three years, another reminder that earnings expansion depends more on pricing cycles than structural growth.
Commodity exposure compounds the risk profile. If oil prices stabilize or weaken, earnings may flatten while valuation multiples compress — a combination that historically produces weak total returns.
Operationally, the company appears safe. Market pricing, however, introduces meaningful investment risk.
Final Assessment
ExxonMobil represents a high-quality, low-risk operating company paired with a high-risk entry price.
The business generates returns above its cost of capital, carries minimal leverage, and maintains a well-covered dividend growing around 4% annually. These characteristics make the payout dependable.
Yet investors are currently paying premium multiples for a mature energy franchise growing only modestly. The dividend yield is below historical norms, valuation ratios sit above long-term averages, and the intrinsic value estimate trails the market price significantly.
For income investors, the stock functions as a stable bond-like equity rather than a compounding dividend grower. Stability is strong — prospective returns are constrained.
The central conclusion follows logically:
ExxonMobil is a solid company but not an attractive dividend investment at the current price.
Future returns are likely to depend less on operational performance and more on whether valuation eventually normalizes.