
Exchange Income Corp: Income Potential Versus Valuation Risk
Operational resilience supports income stability, but investors face a stretched valuation.

Investment Thesis: A Diversified Aviation and Industrial Operator with Stable Cash Flows but Limited Valuation Upside
Exchange Income Corp is a diversified transportation and manufacturing company operating primarily through two segments: aerospace and aviation services, and specialized manufacturing. The company focuses on acquiring profitable niche businesses that generate stable cash flows, particularly in industries where scale and operational expertise provide durable competitive advantages. Its geographic footprint spans Canada, the United States, Europe, and several international markets, providing diversified revenue exposure across different economic environments.
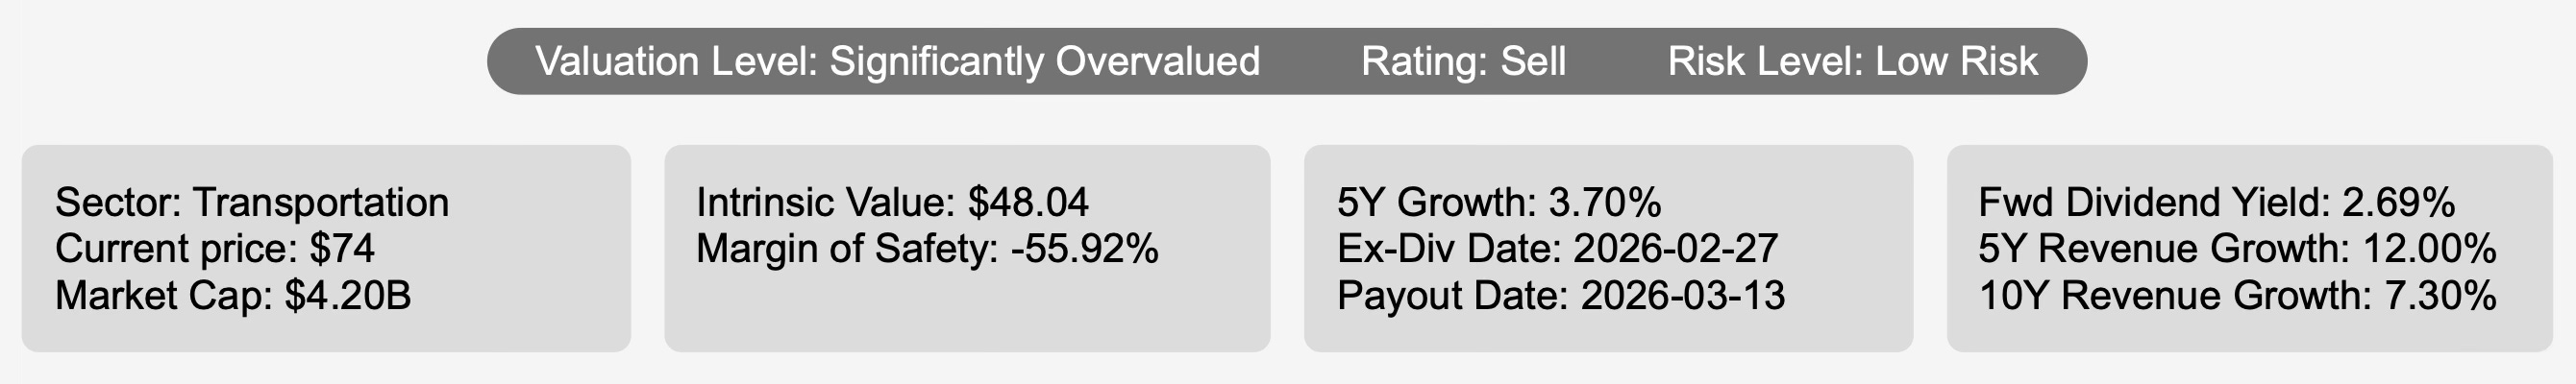
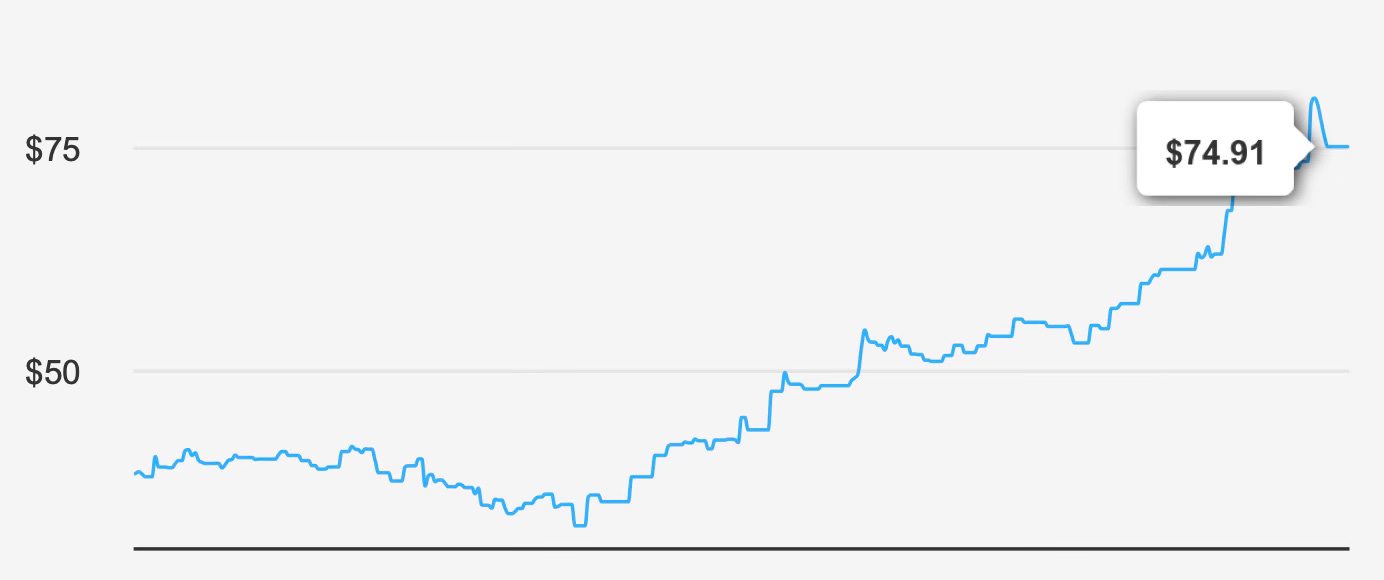
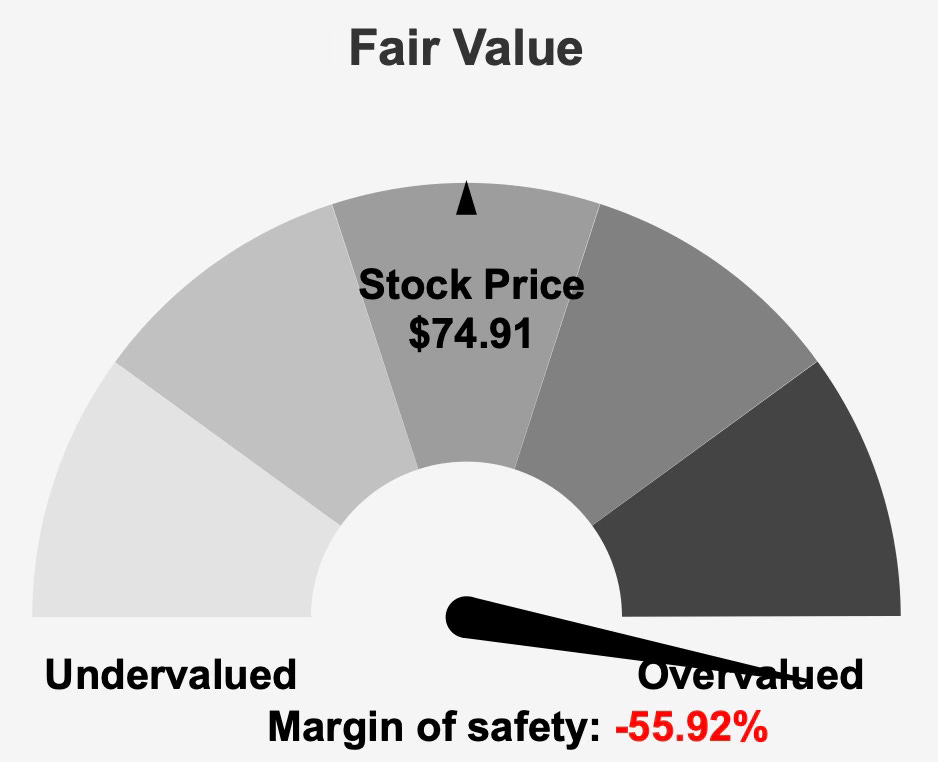
At a share price near $74, the company carries a market capitalization of roughly $4.2 billion. Despite a business model built on stable cash-generating operations, the current valuation appears disconnected from its underlying fundamentals. Estimated intrinsic value stands around $48 per share, implying a negative margin of safety of roughly 56%. In practical terms, this means the market currently prices the stock far above its estimated fair value.
This discrepancy reflects a broader pattern in the market’s perception of stable dividend businesses. Companies that deliver reliable income streams often attract income-focused investors, which can lead to valuation premiums. Exchange Income Corp appears to be experiencing precisely this dynamic. Its reputation as a stable dividend payer combined with consistent acquisition-driven expansion has supported investor demand even as valuation multiples expanded well beyond historical norms.
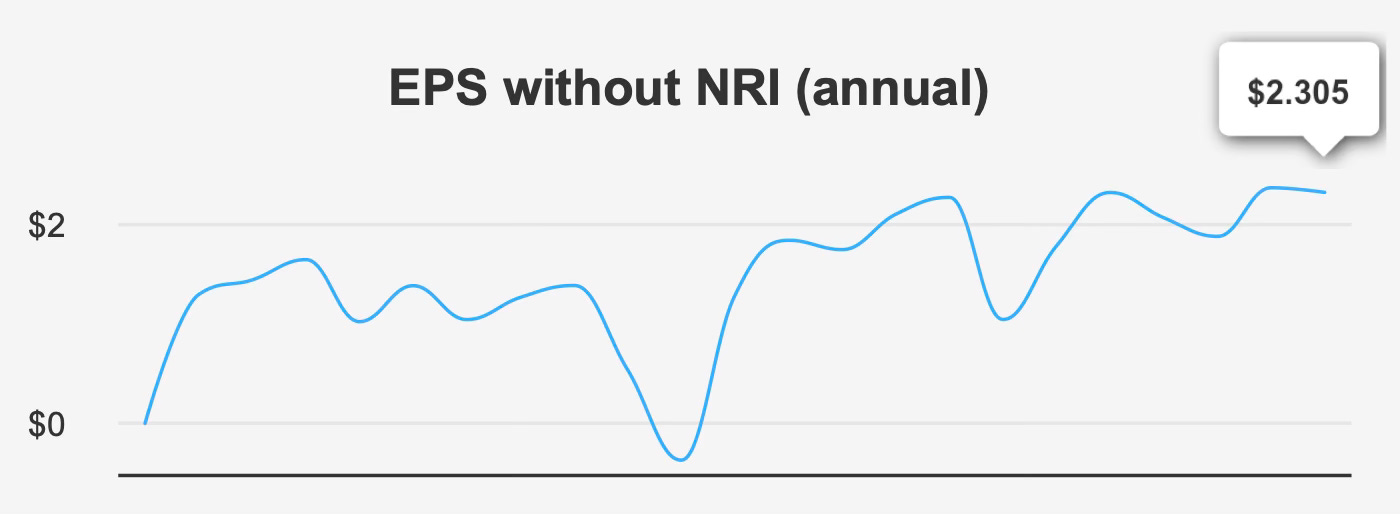
Operationally, the company has demonstrated steady revenue expansion. Revenue has grown at approximately 12% annually over the past five years and about 7.3% over the past decade. Earnings growth has been somewhat more volatile but still respectable. Over the last five years, annual earnings per share excluding non-recurring items have increased at roughly a 15% compound rate, though the longer ten-year growth rate slows to around 3.8%.
The divergence between shorter-term and long-term growth rates highlights the company’s reliance on acquisitions to drive expansion. While acquisitions can accelerate growth, they also introduce integration risks and often require increased leverage. As a result, the sustainability of long-term value creation depends heavily on capital allocation discipline and operational execution.
Another notable feature of Exchange Income Corp’s capital strategy is its share repurchase activity. Over the past year, the company reduced its share count by approximately 13.2%, while the ten-year reduction stands near 7.2%. Buybacks can enhance per-share metrics and support shareholder returns, particularly when executed during periods of undervaluation. However, repurchases during periods of elevated valuation can diminish long-term capital efficiency.
Taken together, Exchange Income Corp operates a resilient business model with diversified revenue streams and a history of steady dividend payments. Yet the current market valuation significantly limits the margin for error, making the investment case less compelling for new investors seeking attractive entry points.
Earnings Momentum & Profitability Trends
Recent operating results show continued growth in both revenue and earnings, though the pace of improvement has moderated in the most recent quarter.
For the quarter ending December 31, 2025, earnings per share excluding non-recurring items reached $0.693. This figure represented a sequential decline from $0.918 in the prior quarter but remained well above the $0.477 reported in the same period a year earlier. Revenue per share showed a similar pattern. At $11.87, it dipped slightly from $12.12 in the previous quarter but increased significantly from $9.13 in the fourth quarter of the prior year.
This pattern reflects the company’s typical operational seasonality combined with steady long-term demand in its operating segments. Aerospace and aviation operations benefit from essential service contracts and specialized regional aviation services, while the manufacturing segment provides environmental access solutions, window systems, and precision engineering components. These businesses operate in niche markets where competition is limited and switching costs are relatively high.
Margins have remained relatively stable despite operating in capital-intensive industries. Gross margin in the most recent quarter reached approximately 24.8%, slightly above the company’s five-year median near 23.9%. While this level remains below the historical peak of roughly 27.6%, it indicates stable operational efficiency in the current environment.
Looking ahead, consensus forecasts anticipate moderate earnings expansion. Analysts estimate earnings of approximately $2.88 per share in the next fiscal year and roughly $3.56 the following year. Revenue projections similarly point toward continued expansion, with expectations for revenue to reach roughly $2.7 billion in 2026 and approximately $3.1 billion by 2028.
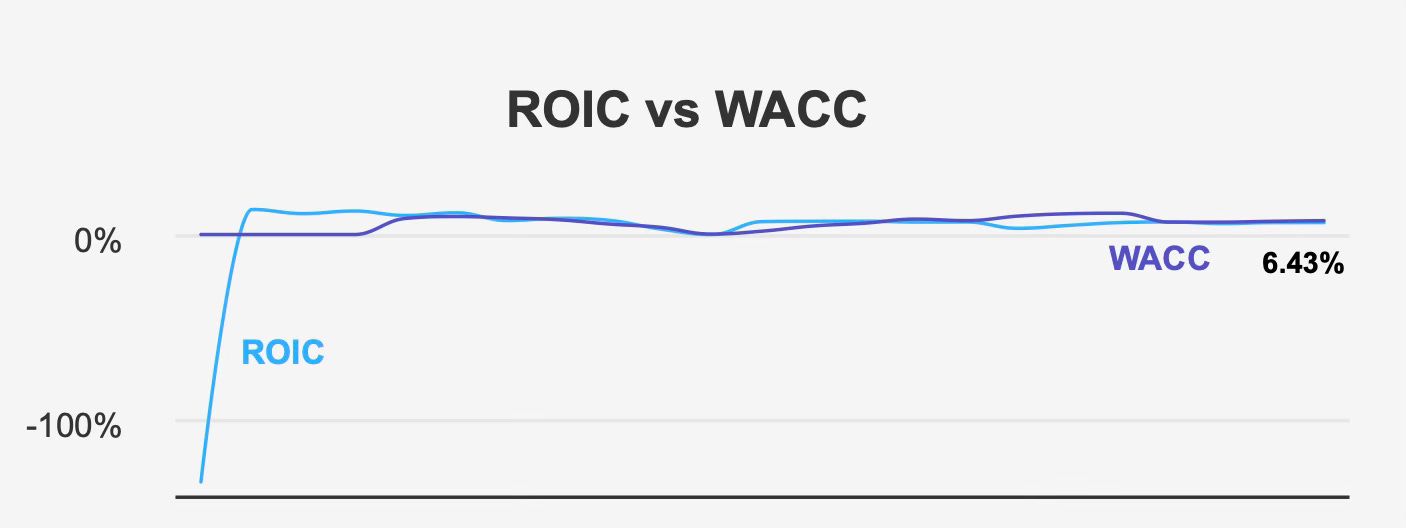
Despite these positive growth projections, a deeper look at capital efficiency reveals a more complex picture. Over the past five years, the company’s median return on invested capital has been about 6.3%, while its weighted average cost of capital has averaged approximately 7.2%. In the most recent period, return on invested capital stands near 6.4% compared with a cost of capital around 7.5%.
This gap indicates that the company has historically struggled to consistently generate economic value above its cost of capital. When return on invested capital falls below the cost of capital, growth can actually erode shareholder value despite rising revenues and earnings.
Return on equity currently stands near 10.9%, suggesting solid profitability relative to shareholder capital. However, return on equity alone does not fully capture capital efficiency, particularly for companies that rely on leverage to finance acquisitions.
From a strategic perspective, management’s challenge lies in improving capital allocation efficiency while maintaining growth. Enhancing operational margins, improving asset utilization, and ensuring disciplined acquisition pricing will be essential for generating sustainable value creation.
Dividend Profile & Sustainability
Exchange Income Corp has established itself as a steady dividend payer, though its dividend growth profile is best described as modest rather than aggressive.
The company currently offers a forward dividend yield of roughly 2.6%. While respectable relative to broader equity markets, this yield is significantly below the company’s historical norms. Over the past decade, the median dividend yield has been approximately 5.5%, suggesting the current yield compression largely reflects rising share prices rather than rapidly growing dividend payments.
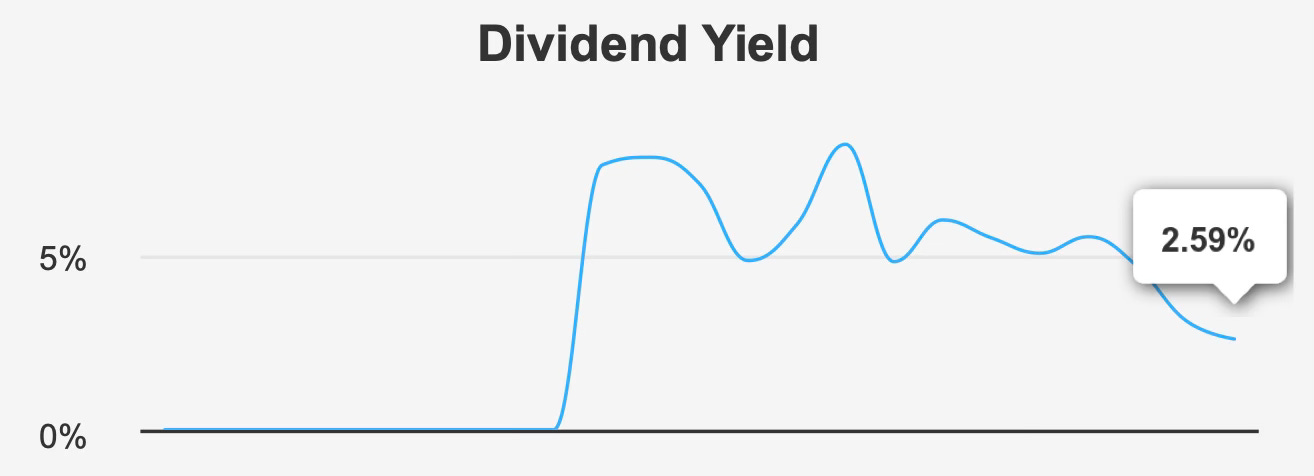
Dividend growth has been steady but measured. Over the past five years, the dividend has grown at an annual rate of approximately 3.7%, while the three-year growth rate stands near 3.3%. Forward expectations suggest dividend growth of roughly 4.2% annually, indicating management intends to continue gradual increases rather than aggressive distribution expansion.
The sustainability of the dividend appears relatively stable but requires monitoring. The current payout ratio stands around 83%, a substantial improvement compared with historical levels that exceeded 100%. A lower payout ratio improves dividend coverage and reduces the likelihood that distributions will exceed earnings.
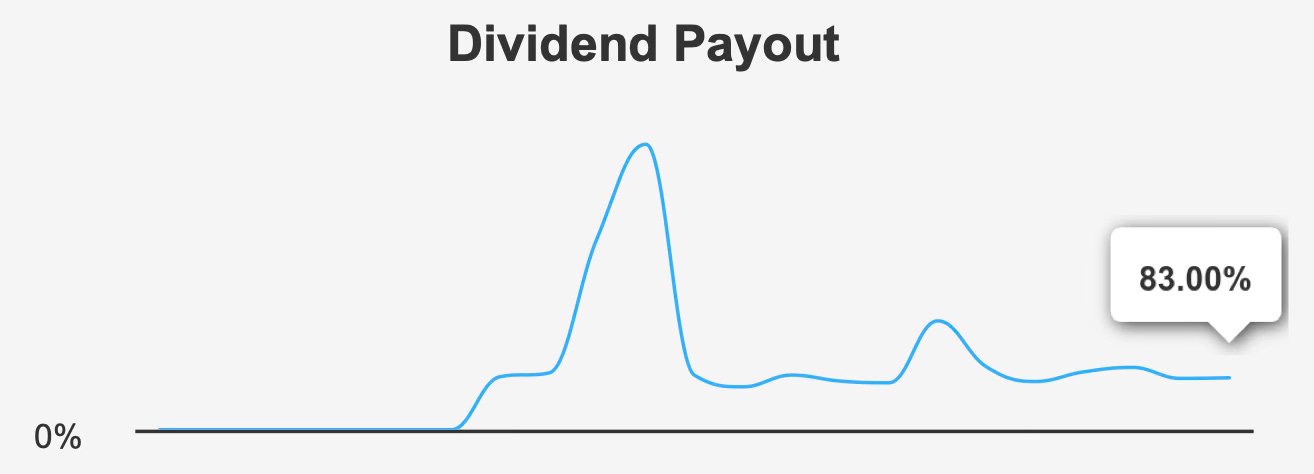
Even so, an 83% payout ratio remains relatively high compared with many dividend-focused companies. A large portion of earnings continues to be distributed to shareholders rather than retained for reinvestment. This approach can constrain financial flexibility, particularly for companies pursuing acquisition-driven growth strategies.
Dividend coverage currently stands near 1.16, indicating earnings exceed dividend obligations by a modest margin. While this level supports dividend sustainability under normal conditions, it leaves limited room for earnings volatility.
Leverage represents another factor influencing dividend sustainability. The company’s debt-to-EBITDA ratio currently stands around 3.3. This level is generally considered moderate within capital-intensive industries but still warrants attention. Companies with elevated leverage must balance debt obligations, acquisition funding, and shareholder distributions.
Overall, Exchange Income Corp’s dividend appears stable in the near term, supported by steady operating cash flows and diversified business segments. However, the combination of high payout ratios and moderate leverage suggests that future dividend growth will likely remain incremental rather than rapid.
Valuation Perspective: Premium Multiples and a Negative Margin of Safety
The most striking aspect of Exchange Income Corp’s investment profile is its current valuation relative to underlying fundamentals.
Based on fundamental valuation models, intrinsic value is estimated around $48 per share, significantly below the current market price of roughly $74. This gap implies a negative margin of safety of about 56%, meaning investors are paying a substantial premium relative to estimated fair value.
Traditional valuation metrics reinforce this conclusion. The stock currently trades at approximately 32.9x trailing earnings, well above the company’s ten-year median multiple of roughly 19.2x. While elevated multiples can sometimes reflect stronger growth expectations, Exchange Income Corp’s projected growth rates remain relatively modest.
Forward valuation metrics appear slightly more moderate but still elevated. The forward price-to-earnings ratio sits near 24.9x, indicating investors are already pricing in much of the anticipated earnings expansion.
Enterprise value metrics show a similar pattern. The company’s EV/EBITDA ratio stands around 10.7x, above the ten-year median near 8.4x. This premium suggests the market assigns higher valuation multiples to the company than historical norms would justify.
Balance sheet valuation metrics also indicate expansion in market expectations. The price-to-book ratio currently sits near 3.2x, compared with a ten-year median of roughly 2.0x. In practical terms, investors are paying significantly more for each dollar of book value than they have historically.
An unusual feature of the current valuation profile is the absence of free cash flow multiple data due to minimal or inconsistent free cash flow generation in recent periods. This may reflect strategic investments or capital expenditures associated with acquisitions.
Taken together, these valuation indicators suggest that the current market price reflects optimistic assumptions regarding future growth, margin stability, and dividend reliability. While these outcomes remain possible, the elevated multiples leave little room for disappointment.
For long-term investors, valuation discipline remains a critical component of successful dividend investing. Purchasing high-quality dividend companies at excessive valuations can significantly reduce long-term returns, even when underlying business performance remains solid.
Risk Assessment & Capital Structure Considerations
Exchange Income Corp’s risk profile is best described as balanced between operational stability and financial leverage considerations.
On the positive side, the company demonstrates several indicators of financial health. Its Piotroski F-Score stands at 7, suggesting strong underlying financial fundamentals. Additionally, statistical measures indicate a low likelihood of earnings manipulation, reinforcing confidence in reported financial results.
Operating performance also shows encouraging signs. Revenue and earnings have grown consistently over time, and operating margins have expanded gradually. These trends suggest management has successfully integrated acquisitions while maintaining operational efficiency.
Nevertheless, several structural risks remain.
One notable concern is the company’s reliance on debt to finance expansion. Over the past three years, Exchange Income Corp has issued approximately CAD 792 million in new debt. While leverage remains manageable, sustained borrowing could increase financial risk if operating conditions weaken.
Asset growth provides another potential signal of efficiency concerns. Company assets have expanded at roughly 19% annually, significantly faster than revenue growth of around 12% over the past five years. When assets grow faster than revenue, it can indicate declining asset productivity.
Financial stress indicators also highlight potential vulnerabilities. The company’s Altman Z-Score stands near 1.9, placing it in the so-called “grey zone” between financial stability and potential distress.
Liquidity in the stock itself also appears somewhat limited. Average daily trading volume over the past two months has been approximately 13,473 shares, and recent trading activity has occasionally been extremely low. Limited liquidity can lead to wider bid-ask spreads and increased price volatility.
Institutional ownership currently stands around 9%, while insider ownership is minimal. Although this does not necessarily imply negative sentiment, low insider ownership can sometimes indicate weaker alignment between management and shareholder interests.
Despite these risks, Exchange Income Corp’s diversified business structure and stable operating segments provide meaningful downside protection. Essential aviation services and specialized manufacturing operations tend to maintain steady demand even during economic downturns.
Final Assessment
Exchange Income Corp represents a stable dividend-paying business operating across specialized aviation and manufacturing markets. Its diversified revenue base, steady earnings growth, and consistent dividend payments make it an attractive company from an operational standpoint.
However, investment success depends not only on business quality but also on valuation discipline. At current prices, the stock trades at elevated multiples across nearly every major valuation metric. The estimated intrinsic value significantly below the market price indicates a limited margin of safety for new investors.
The dividend itself appears sustainable, supported by stable operating cash flows and diversified operations. Nevertheless, the relatively high payout ratio and moderate leverage levels suggest dividend growth will likely remain gradual rather than accelerating.
From a long-term perspective, Exchange Income Corp remains a fundamentally solid business with respectable growth prospects. Yet the current valuation premium significantly reduces expected returns for investors initiating positions at today’s price levels.
For income-focused investors, the company may still warrant monitoring due to its consistent dividend record and stable business model. However, a more attractive entry point — closer to underlying intrinsic value — would likely provide a better balance between income generation and capital appreciation potential.