
Ellington Financial Inc: Attractive Yield Masking Structural Earnings Weakness
Assessing whether Ellington’s high yield compensates for weak capital returns.

Investment Thesis: A Double-Digit Yield Supported by Financial Engineering Rather Than Durable Earnings
Ellington Financial Inc. EFC 0.00%↑ operates as a specialty finance company focused primarily on mortgage-related assets and reverse mortgage origination through its Longbridge segment. The firm’s investment portfolio spans residential and commercial mortgage loans, mortgage-backed securities, derivatives, and equity investments tied to loan origination platforms. This diversified asset base is designed to produce attractive risk-adjusted returns through both interest income and opportunistic investment activity.
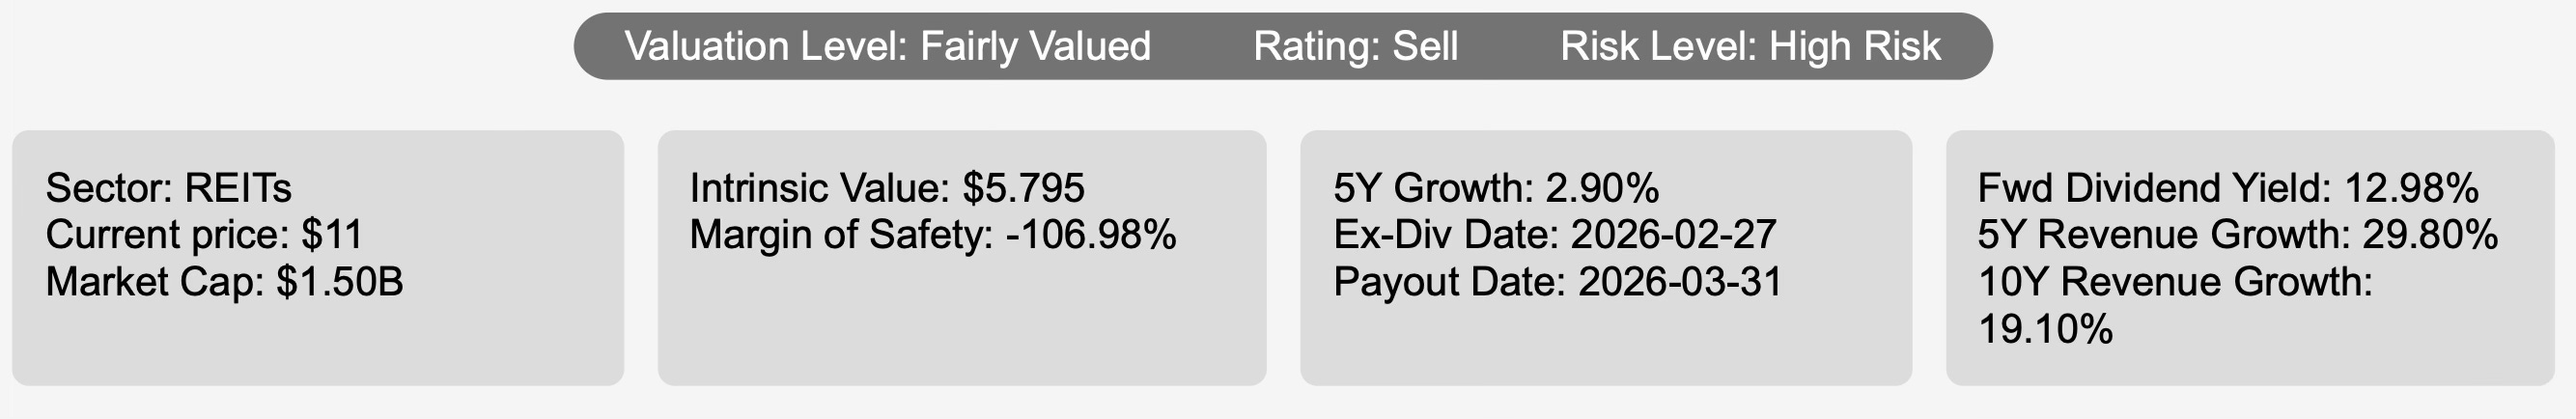
At first glance, Ellington Financial appears compelling for income investors. The company currently offers a forward dividend yield of approximately 13.0%, a level that places it among the highest-yielding securities in the broader REIT and specialty finance landscape. Such a yield naturally attracts investors seeking consistent income streams in a market where dependable dividend income remains scarce.
However, a deeper examination reveals that the dividend profile is not supported by consistently growing earnings or strong capital efficiency. The firm’s dividend payout ratio stands at roughly 120%, indicating that the company distributes significantly more cash than it generates through net earnings. Dividend coverage sits at just 0.79x, reinforcing concerns that current payouts exceed the sustainable level supported by underlying profitability.
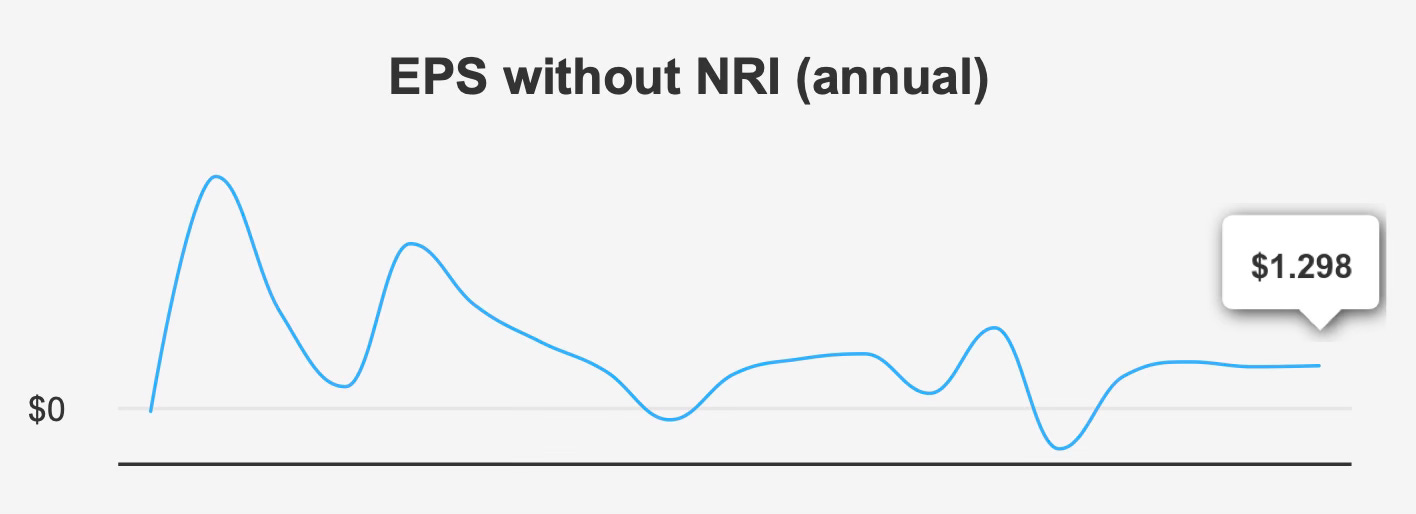
The company’s earnings trajectory further complicates the investment case. Over the past decade, Ellington Financial has delivered essentially no compound earnings growth, with a ten-year earnings per share compound annual growth rate effectively flat. This stagnation highlights a core challenge: the firm has been unable to translate asset expansion and investment activity into durable profit growth.
Capital efficiency metrics reinforce this concern. Over the last five years, the company’s return on invested capital has averaged approximately 0.0%, well below its estimated weighted average cost of capital of about 2.7%. When a firm consistently earns returns below its cost of capital, it effectively destroys shareholder value rather than creating it.
Despite these weaknesses, Ellington Financial has pursued capital allocation strategies designed to stabilize shareholder returns. Share buybacks have played a role in this approach, with a one-year buyback ratio of –24.8%. Historically, however, this trend has moderated over longer periods, with three-year and five-year buyback ratios of –21.0% and –20.0%, respectively. These figures suggest that the company has reduced repurchase activity over time, potentially reflecting tighter financial flexibility.
Taken together, Ellington Financial represents a classic high-yield security whose income appeal may obscure structural weaknesses. The firm’s dividend remains attractive on the surface, yet the combination of stagnant earnings, weak capital efficiency, and elevated payout ratios suggests that the yield may be compensating investors for elevated risk rather than reflecting genuine financial strength.
Earnings Momentum and Profitability Trends
Recent operating results highlight the fragile nature of Ellington Financial’s earnings profile. In the quarter ending December 31, 2025, earnings per share excluding non-recurring items declined sharply to $0.154, down from $0.322 in the preceding quarter and $0.271 in the comparable period one year earlier. On a diluted basis, earnings fell to $0.14, compared with $0.29 in the third quarter of 2025 and $0.25 in the fourth quarter of 2024.
Revenue trends show similar weakness. Revenue per share for the quarter came in at $0.677, compared with $0.746 in the previous quarter and $0.749 in the same quarter of the prior year. These declines indicate that both earnings power and revenue generation have softened over the past year.
While quarterly volatility is not unusual in mortgage-focused finance companies, the longer-term trend provides little reassurance. Over both the five-year and ten-year horizons, the company’s earnings growth rate has remained essentially flat. A decade without meaningful earnings expansion raises questions about the durability of the firm’s business model and its ability to generate shareholder value through cyclical market environments.
Profitability metrics further illustrate the challenge. The company’s gross margin has remained at 0.0% over the long term, reflecting the accounting structure of many mortgage investment vehicles but still underscoring the absence of strong underlying operating margins. More concerning is the persistent gap between capital returns and the firm’s cost of capital.
Over the past five years, Ellington Financial’s return on invested capital has averaged roughly 0.0%. In contrast, the company’s weighted average cost of capital stands near 2.7%. In practical terms, this means that each dollar invested in the business generates less return than it costs the firm to finance that investment.
Return on equity presents a somewhat more favorable picture, with a five-year median of about 8.6%. However, this metric alone does not offset the broader capital efficiency problem, particularly when leverage and asset growth are considered.
Looking forward, analysts expect some improvement in earnings performance. Forecasts suggest earnings per share could rise to approximately 1.77 in the next fiscal year and 1.90 in the following year. Revenue projections also point toward growth, with estimates of roughly $224.1 million in 2026, $320.6 million in 2027, and $433.9 million in 2028.
These projections imply that the company could begin to translate its asset expansion into stronger income generation. Nevertheless, the credibility of these forecasts remains uncertain given the firm’s historical inability to produce sustained earnings growth.
The broader industry outlook is also relatively modest. Over the next decade, the sector is expected to grow at an average rate of about 5% annually. If Ellington Financial merely tracks the industry average, its long-term earnings expansion may remain limited, particularly if capital allocation inefficiencies persist.
Dividend Profile and Sustainability
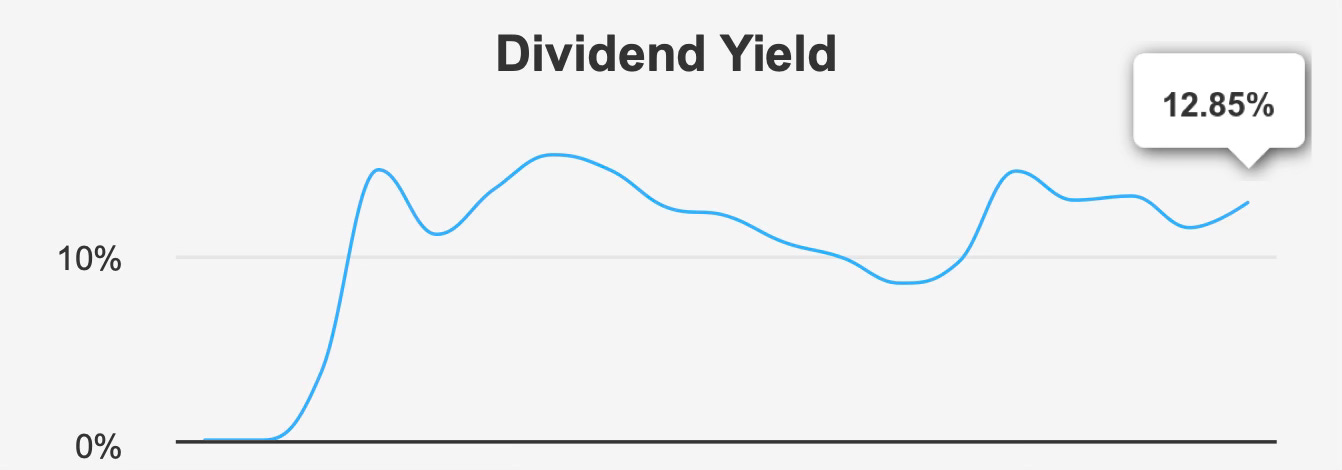
Ellington Financial’s dividend remains the central element of its investment appeal. The company currently distributes quarterly dividends of $0.13 per share, providing a forward dividend yield of approximately 13.0%. This yield is exceptionally high relative to most publicly traded income vehicles and clearly positions the stock as an income-focused investment.
However, the sustainability of this dividend warrants careful examination. The company’s payout ratio of approximately 120% indicates that the dividend exceeds net earnings. In practical terms, the firm is returning more cash to shareholders than it generates through profit.
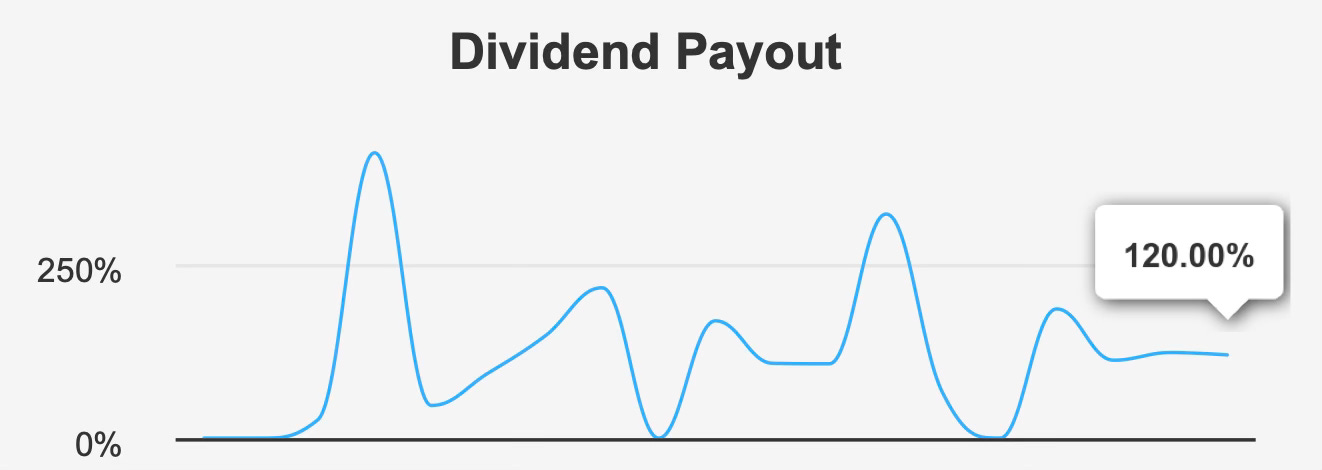
Dividend coverage ratios reinforce this concern. With coverage at just 0.79x, current earnings do not fully support the existing dividend level. Without meaningful earnings improvement, maintaining this payout could require continued reliance on balance sheet flexibility or asset sales.
Historical dividend growth has also been modest. Over the past three years, the dividend growth rate has been negative at roughly –4.7%, reflecting a period of distribution pressure. Over a longer five-year horizon, dividend growth improves slightly to about 2.9%, though this pace remains relatively slow for a company distributing such a high yield.
The company’s long-term yield profile further illustrates the situation. Ellington Financial’s ten-year median dividend yield stands around 11.9%. The current yield of nearly 13.0% therefore sits near the upper end of the historical range, suggesting that the market may be pricing in elevated risk rather than simply rewarding stable income generation.
Looking ahead, forecasts suggest that dividend growth could average around 2.4% annually over the next three to five years. While this indicates the possibility of incremental improvement, such growth would remain modest relative to the current payout level.
The next dividend milestone is the ex-dividend date scheduled for February 27, 2026, with the corresponding payment expected on March 31, 2026. These dates maintain the company’s established quarterly distribution schedule.
Ultimately, Ellington Financial’s dividend offers substantial income but comes with clear sustainability questions. Unless earnings growth accelerates meaningfully, the current payout ratio may prove difficult to maintain over the long term.
Valuation Perspective: Market Pricing Reflects Yield Appeal Despite Weak Value Creation
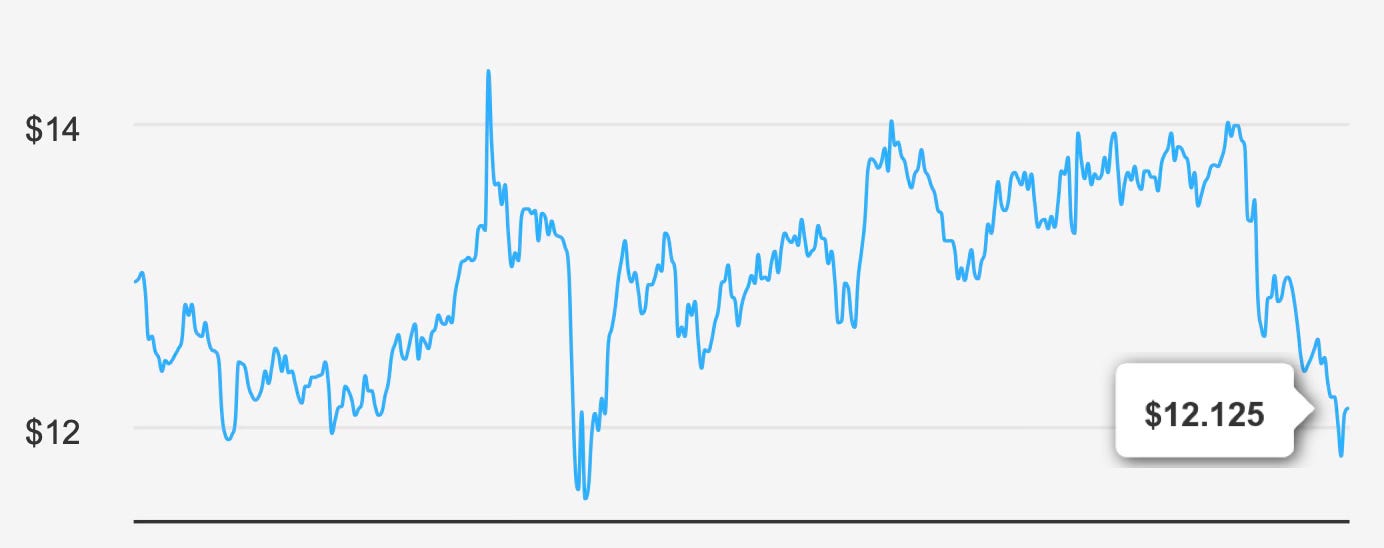
From a valuation standpoint, Ellington Financial presents a complex picture. The company’s current market price is approximately $11 per share, translating to a market capitalization near $1.50 billion.
However, intrinsic value estimates place the company’s fair value closer to $5.80 per share. This implies a negative margin of safety of roughly –107.0%, suggesting that the stock may be significantly overvalued relative to its estimated fundamental worth.
Such a valuation gap indicates that the market may be pricing Ellington Financial primarily as a yield vehicle rather than as a fundamentally strong growth or value opportunity. Investors appear willing to accept elevated risk in exchange for the company’s double-digit dividend yield.
Growth metrics also reinforce the limited valuation upside. Over the past five years, overall growth has averaged around 2.9%, a relatively modest rate for a company operating in a capital-intensive investment sector. While revenue growth has been stronger—roughly 29.8% over five years—the disconnect between revenue expansion and stagnant earnings highlights operational inefficiencies.
In essence, the company has expanded its asset base and investment activities without generating commensurate improvements in profitability.
This mismatch between growth and profitability explains why valuation metrics remain under pressure. Investors seeking income may continue to support the stock price, but without stronger earnings generation, long-term valuation expansion appears unlikely.
Risk Assessment and Capital Structure Considerations
Ellington Financial’s risk profile contains several notable warning signs that prospective investors should evaluate carefully.
Over the past three years, the company has issued approximately $6.2 billion in debt. While leverage is a common feature of mortgage-focused investment firms, such rapid debt accumulation raises questions about financial flexibility and balance sheet resilience.
At the same time, the firm’s asset base has expanded rapidly, growing at roughly 42.3% annually. While asset growth can signal business expansion, it has outpaced revenue growth of about 29.8%, suggesting declining operational efficiency.
Additional financial indicators reinforce this cautious outlook. The company’s Piotroski F-Score stands at just 2, a level typically associated with weaker financial quality. Low scores in this framework often indicate deteriorating fundamentals or limited financial strength.
Accounting quality metrics also present mixed signals. The company’s Beneish M-Score of –2.23 suggests a low probability of earnings manipulation, which provides some reassurance regarding financial reporting integrity. However, the firm’s Sloan ratio of approximately 26.6% indicates that a large portion of reported earnings may be derived from accruals rather than cash flows.
High accrual ratios can reduce earnings reliability and introduce additional uncertainty into financial analysis.
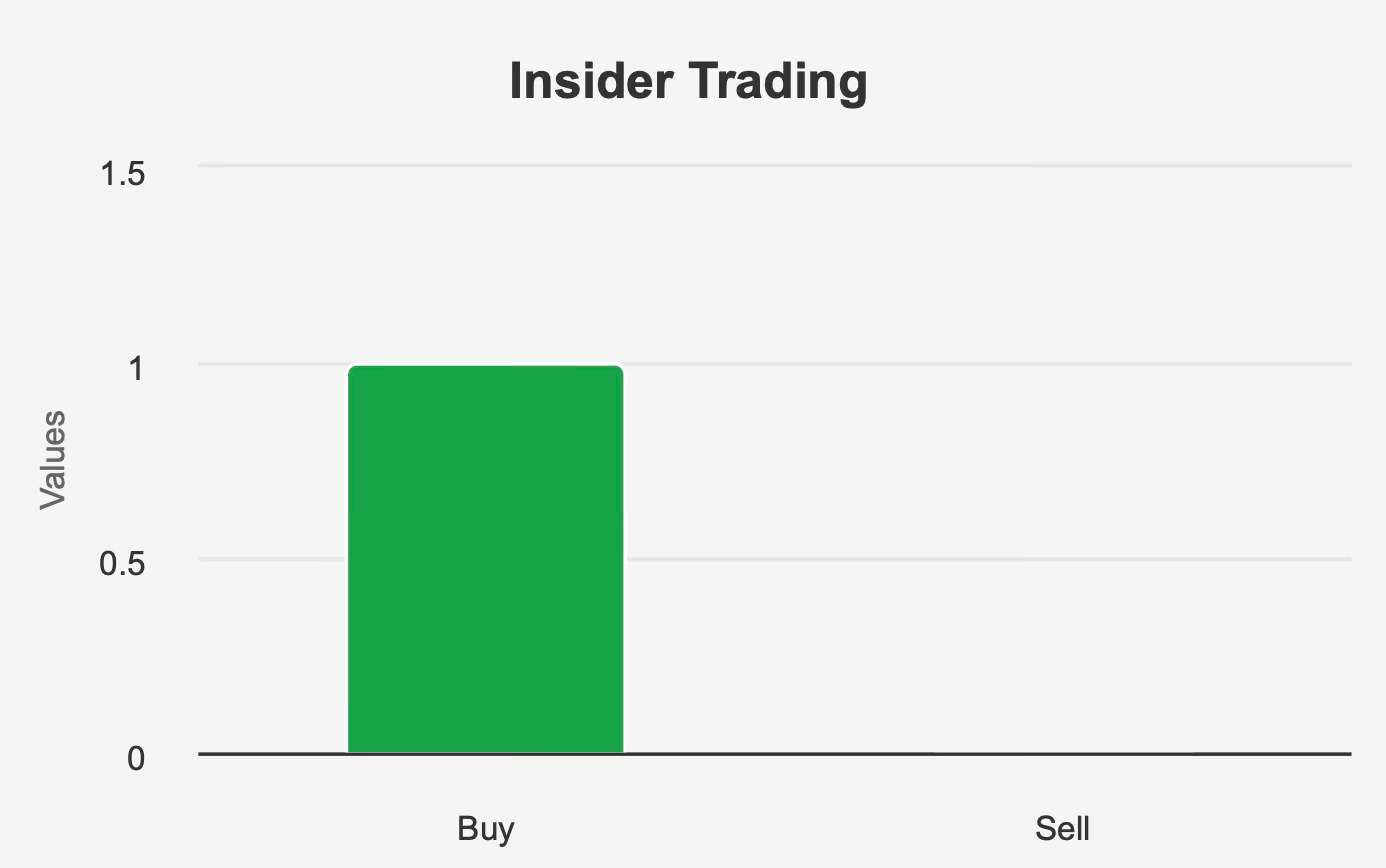
Insider activity offers limited insight into management sentiment. Over the past twelve months, there has been only a single insider purchase and no insider sales. Insider ownership remains extremely low at about 0.16%, suggesting limited alignment between management and shareholders.
While the absence of insider selling may be viewed as neutral, the minimal level of insider ownership does little to strengthen investor confidence.
Overall, Ellington Financial’s risk profile reflects a combination of leverage expansion, weak capital efficiency, and elevated payout commitments. These factors collectively contribute to the company’s classification as a high-risk investment.
Final Assessment
Ellington Financial presents investors with a compelling yet complex opportunity. The company’s nearly 13% dividend yield is undeniably attractive and positions the stock as one of the highest-yielding income vehicles in the market.
However, the sustainability of that income remains uncertain. Earnings growth has been stagnant for more than a decade, and the company currently distributes more cash than it generates through net income. Capital efficiency metrics indicate that the firm consistently earns returns below its cost of capital, a situation that undermines long-term value creation.
The company’s rapid asset expansion and growing leverage further complicate the outlook. While revenue forecasts suggest potential improvement in the coming years, the historical disconnect between asset growth and profitability raises questions about whether those projections will translate into durable earnings expansion.
From a valuation perspective, the stock appears expensive relative to intrinsic value estimates, implying that investors may already be paying a premium for the company’s high dividend yield.
For income-focused investors willing to accept elevated risk, Ellington Financial may still offer short-term yield appeal. However, for long-term dividend investors prioritizing sustainability and capital efficiency, the company’s financial profile raises meaningful concerns.
In its current form, Ellington Financial appears less like a stable dividend compounder and more like a high-yield instrument whose income stream depends heavily on favorable market conditions and continued balance sheet flexibility.