
Dynacor Group: Strong Capital Returns Meet a Fully Valued Share Price
Examining whether Dynacor Group’s strong return profile and conservative balance sheet justify its current valuation.

1. Investment Thesis: A Capital-Efficient Gold Processor Delivering Strong Growth but Limited Valuation Upside
Dynacor Group Inc. operates as a dividend-paying gold production company focused primarily on processing ore through government-approved facilities in Peru. Its operations center on mineral resource evaluation and processing, with the Veta Dorada processing plant serving as the company’s primary operational asset. Dynacor also maintains exploration exposure through properties such as Tumipampa and Anta. Revenue is generated from the sale of precious metals derived from these ore-processing activities.
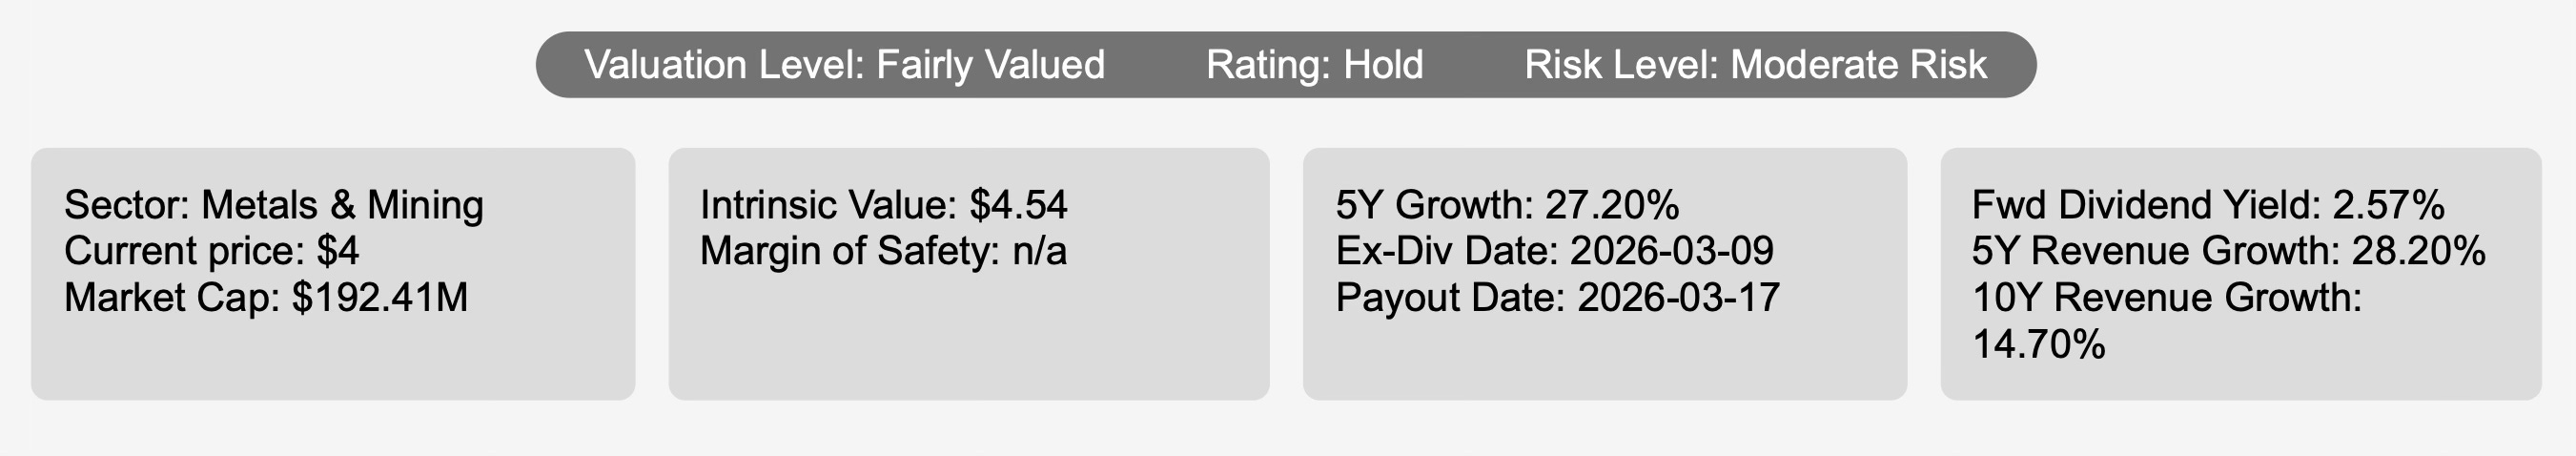
At roughly $4 per share with a market capitalization of approximately $192.4 million, Dynacor represents a relatively small but established participant within the metals and mining sector. The company has demonstrated a notable ability to generate shareholder value through disciplined capital allocation and steady operational execution. Over the past decade, Dynacor has consistently produced returns on invested capital well above its cost of capital, reinforcing the strength of its operating model.
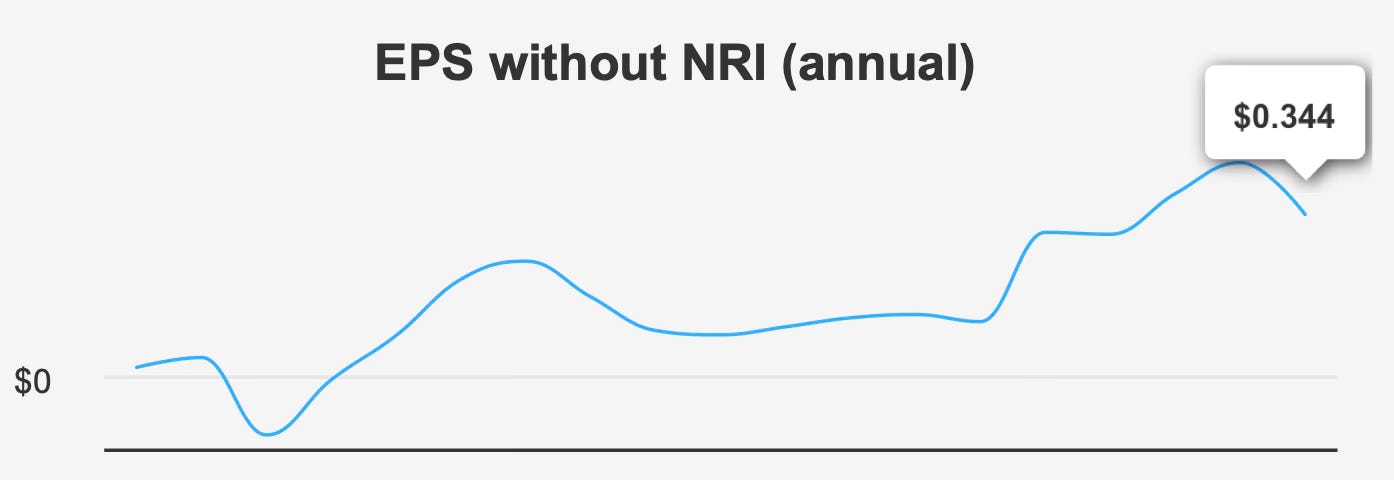
Growth has also been a defining feature of the business. Over the past five years, revenue has expanded at a compound annual rate of 28.2%, while earnings growth has been even more impressive. Earnings per share excluding non-recurring items have compounded at approximately 34.4% over the same period, and at 16.9% across the past decade. These figures indicate that Dynacor has been able to scale operations effectively while maintaining profitability.
Industry conditions further support the company’s positioning. The broader mining sector is projected to expand at roughly 5% annually over the coming decade. Dynacor’s historical growth has significantly outpaced this baseline, suggesting that the firm’s operational strategy and asset base allow it to capture a disproportionate share of industry expansion.
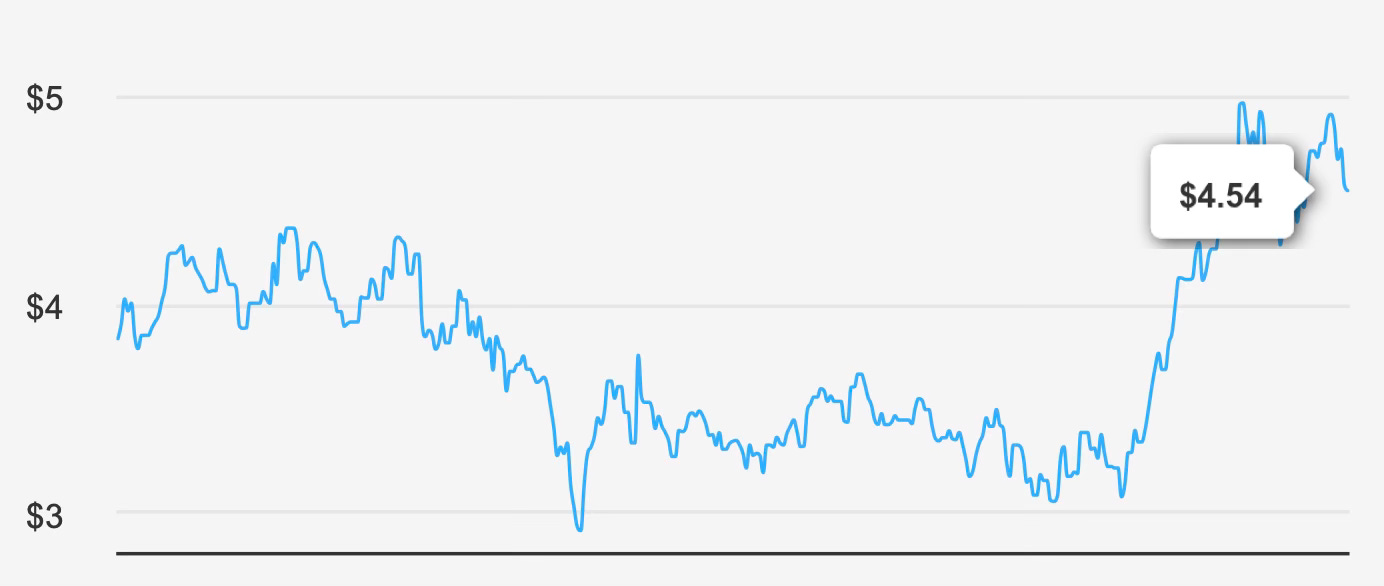
However, despite these attractive characteristics, the investment case is tempered by the company’s current valuation. Dynacor’s intrinsic value estimate is approximately $4.54 per share, while the stock trades around $4, implying that the shares sit close to fair value with little margin of safety. Investors therefore face a trade-off between strong operational fundamentals and a valuation that already reflects much of the company’s recent success.
In other words, Dynacor appears to be a well-run business with durable profitability and disciplined capital management, but current pricing suggests that future returns will likely depend more on continued earnings growth than on multiple expansion.
2. Earnings Momentum & Profitability Trends
Dynacor’s recent operating performance highlights both the company’s growth trajectory and emerging margin pressures.
In the most recent reported quarter ending September 2025, earnings per share excluding non-recurring items reached $0.12. This represents a substantial improvement from $0.058 in the preceding quarter, though it remains below the $0.16 recorded during the same period a year earlier. The sequential improvement suggests operational recovery following a softer period earlier in the year, but the year-over-year comparison indicates that profitability remains somewhat volatile.
Revenue growth, however, has remained robust. Revenue per share increased to $2.36 from $1.85 in the previous quarter, reflecting strong top-line momentum. This growth aligns with the company’s multi-year expansion trend and indicates continued demand for Dynacor’s ore-processing services.
Looking ahead, analyst projections reinforce the growth narrative. Revenue is expected to reach approximately $553.0 million by 2026 and expand further to $727.4 million by 2027. If achieved, this trajectory would sustain the company’s historically strong growth profile and support continued earnings expansion.
Forecast earnings estimates also reflect this outlook. Analysts project earnings per share of roughly $0.456 for the next fiscal year and approximately $0.496 for the following year. While the increase appears modest, it indicates steady profitability growth rather than a rapid acceleration.
From a profitability perspective, Dynacor continues to generate solid returns on capital. The company’s five-year median return on invested capital stands at 22.1%, significantly exceeding its median weighted average cost of capital of 7.8%. This spread demonstrates that Dynacor consistently generates economic value, deploying capital in projects that produce returns well above the cost of financing.
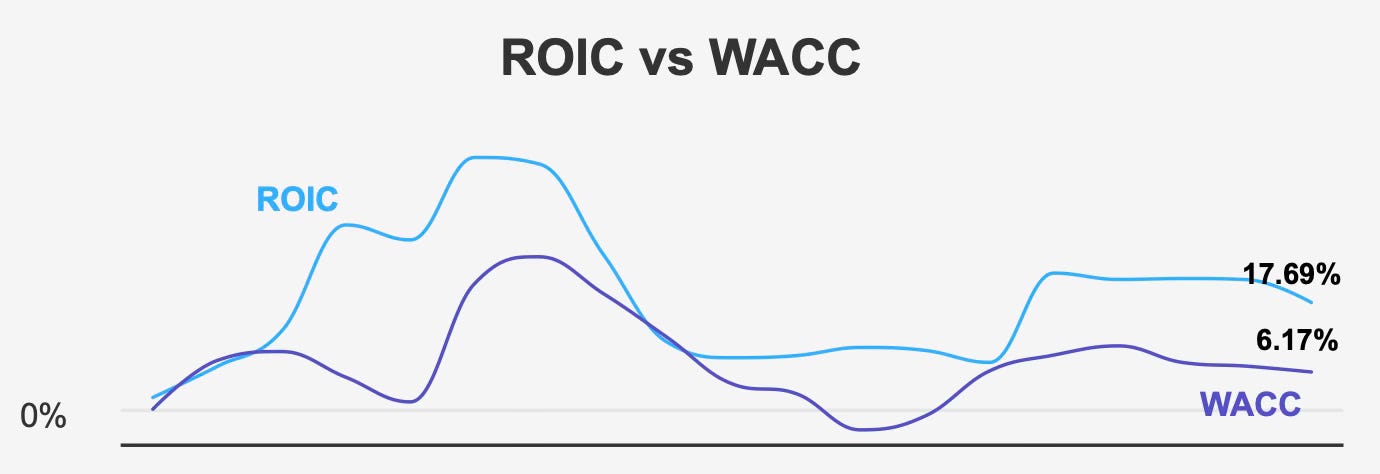
Even in the most recent period, capital efficiency remains strong. Return on invested capital currently stands at 17.8%, comfortably above the current WACC of 6.2%. Although slightly below the five-year median, the persistence of this positive spread suggests that management continues to allocate capital effectively.
Return on equity provides a similar picture. Dynacor’s ROE stands at 13.8%, below its historical peak of 18.4% but still indicative of a profitable and efficiently run enterprise.
One area that warrants attention is the company’s gross margin trajectory. The most recent quarter reported a gross margin of 10.25%, which sits near the lower end of the company’s ten-year range. Historically, Dynacor’s gross margins have reached as high as 16.01%, with a median level of roughly 12.92%. The recent compression suggests rising operational costs or pricing pressures that could affect profitability if sustained.
In short, Dynacor continues to demonstrate solid growth and strong capital efficiency, though recent margin pressure introduces an element of uncertainty into the otherwise positive earnings outlook.
3. Dividend Profile & Sustainability
Dynacor has established itself as a reliable dividend payer, supported by strong earnings growth and a conservative payout policy.
The company currently offers a forward dividend yield of approximately 2.5%. While this yield is slightly below the company’s ten-year median of 2.7%, it remains competitive within the metals and mining sector, particularly considering the firm’s growth profile.
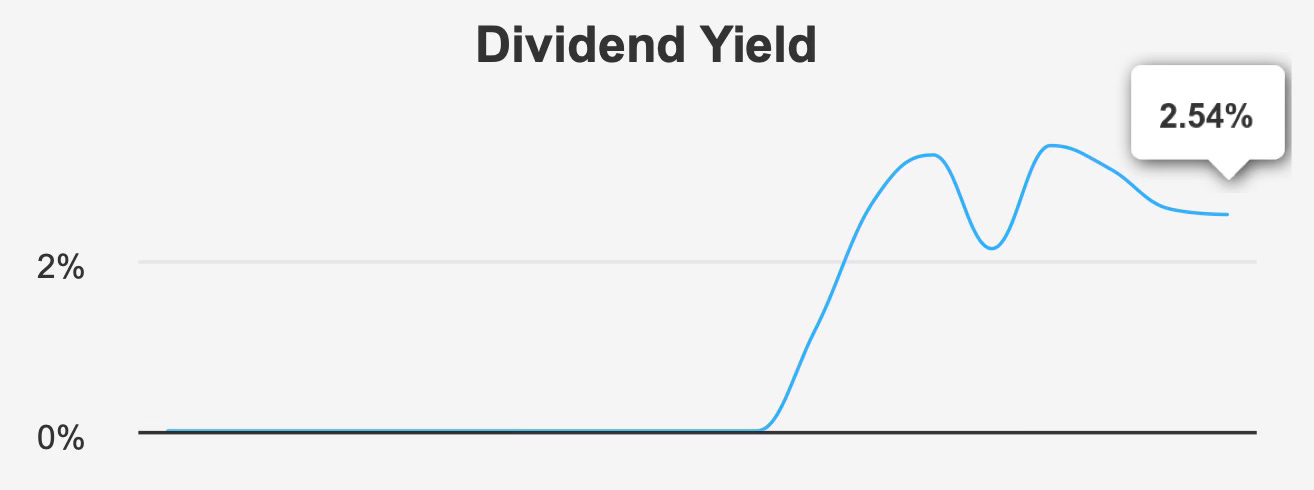
Dividend growth has been particularly impressive. Over the past five years, the dividend has expanded at an annualized rate of roughly 27.2%. Over the past three years, growth has remained strong at approximately 23.8% per share. This record reflects both rising earnings and management’s willingness to return capital to shareholders.
However, forward expectations appear more conservative. Forecasts suggest that dividend growth may remain flat in the near term, implying a projected growth rate of 0%. While this does not necessarily signal a reduction in payouts, it suggests that management may prioritize balance sheet strength or reinvestment opportunities over aggressive dividend increases.
Even without near-term growth, the dividend remains well supported by underlying earnings. Dynacor’s payout ratio is approximately 33.0%, meaning that only about one-third of earnings are currently distributed to shareholders. This level leaves ample room for both reinvestment and potential dividend increases in the future.
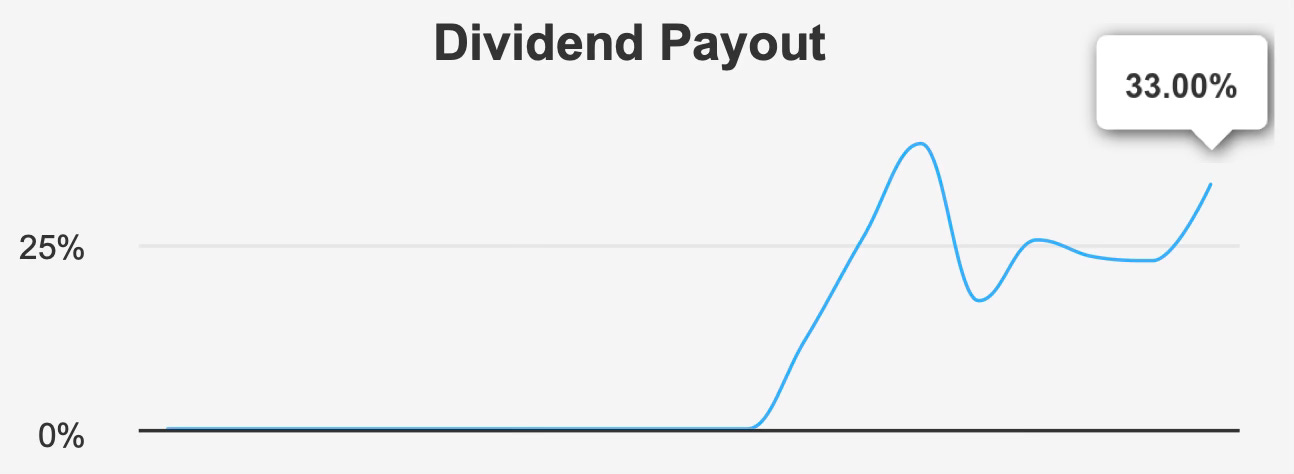
Dividend coverage also appears strong. The company’s coverage ratio stands at roughly 3.3, indicating that earnings comfortably exceed current dividend obligations.
The company’s balance sheet further enhances dividend sustainability. Dynacor’s debt-to-EBITDA ratio is an exceptionally low 0.03, far below the commonly accepted risk threshold of around 2.0. Such minimal leverage gives the company significant financial flexibility and reduces the risk that debt servicing could crowd out shareholder distributions.
Dynacor distributes dividends on a monthly basis, providing a consistent income stream for shareholders. The next ex-dividend date is scheduled for March 9, 2026, with the payout expected on March 17, 2026.
Overall, Dynacor’s dividend profile appears stable and well supported by earnings and balance sheet strength. Although near-term growth may slow, the underlying financial structure suggests that the company’s dividend remains secure.
4. Valuation Analysis: Examining Market Pricing Relative to Historical Multiples and Estimated Intrinsic Value
Dynacor currently trades at a valuation that appears broadly aligned with its intrinsic value, leaving investors with limited margin for error.
The company’s estimated intrinsic value is approximately $4.54 per share. With the stock trading around $4, the difference between market price and intrinsic value is relatively small, indicating that the shares are essentially fairly valued under current assumptions.
From an earnings perspective, Dynacor trades at a trailing price-to-earnings ratio of approximately 12.3x. Forward expectations suggest a lower multiple of roughly 8.3x based on projected earnings growth. This decline indicates that analysts anticipate improved profitability over the coming years.
Relative to historical levels, the forward multiple appears somewhat attractive. Dynacor’s ten-year median P/E stands near 9.8x, suggesting that the forward valuation may sit slightly below the company’s long-term average.
Enterprise value metrics present a somewhat different picture. The company currently trades at about 5.7x EV/EBITDA, above its historical median of roughly 3.8x but well below the historical peak of approximately 12.5x. This positioning indicates that while valuation has expanded relative to the company’s typical range, it remains far from extreme levels seen in previous cycles.
Revenue-based metrics reinforce the view of moderate valuation. Dynacor’s price-to-sales ratio sits near 0.6x, slightly above the historical median of about 0.5x but far below the ten-year high of 1.24x. In absolute terms, this level suggests a relatively low valuation compared with many companies in the broader mining sector.
Book value comparisons show a modest premium. The current price-to-book ratio stands around 1.5x, compared with a ten-year median of approximately 1.1x. This suggests that investors are willing to pay somewhat more for Dynacor’s equity than they historically have, likely reflecting confidence in the company’s profitability and growth record.
One unusual metric within the valuation data is the reported price-to-free-cash-flow ratio of 0.0. Such a figure typically reflects either a temporary disruption in free cash flow or data irregularities and warrants further investigation before drawing firm conclusions.
Taken together, these valuation indicators point to a company that is neither deeply undervalued nor meaningfully overpriced. Instead, Dynacor appears to trade close to its fair value based on historical comparisons and current earnings expectations.
5. Risk Assessment & Capital Structure Considerations
Despite Dynacor’s strong operational track record, several risk factors warrant attention.
One of the more notable concerns is the decline in gross margins. Over time, the company’s margins have shown an average annual decrease of roughly 1.3%. While this trend has not yet undermined profitability, persistent cost pressures could reduce future earnings if not addressed.
Another potential red flag arises from the company’s Beneish M-Score of approximately −1.29. This metric is often used to detect possible earnings manipulation. While the score alone does not confirm financial misrepresentation, it suggests that investors should examine financial reporting closely.
Valuation-related risks also exist. Dynacor’s price-to-book ratio is approaching its five-year high, while the price-to-earnings ratio is nearing a three-year high. The stock price itself is close to a ten-year peak, raising the possibility that expectations may already be embedded in the share price.
Revenue growth, although still positive, has also shown signs of moderation. Slowing growth could make it more difficult for the company to justify its current valuation if operating performance does not accelerate.
Ownership structure presents another consideration. Insider ownership stands at 0%, indicating that company executives and directors do not hold meaningful equity stakes. While this does not necessarily indicate misalignment, many investors prefer to see management with substantial ownership interests.
Institutional ownership is also relatively limited at approximately 4.1%. Low institutional participation may reduce market visibility and liquidity while potentially contributing to higher volatility.
Liquidity itself represents a practical risk for investors. Dynacor’s average daily trading volume is about 1,803 shares, significantly below the two-month average of roughly 4,772 shares. Thin trading volume can lead to wider bid-ask spreads and make it more difficult to execute larger trades without influencing the share price.
Against these risks, Dynacor’s balance sheet provides a meaningful offset. The company’s Altman Z-score stands at 6.97, indicating extremely low bankruptcy risk and highlighting the firm’s financial resilience.
Final Assessment
Dynacor Group represents a compelling example of a small-cap mining company that has successfully combined strong operational execution with disciplined capital management.
The company’s long-term growth record is impressive, with revenue and earnings expanding at double-digit rates for many years. Capital efficiency remains a defining strength, as evidenced by a consistent return on invested capital well above the company’s cost of capital.
Dividend sustainability is another positive feature. A modest payout ratio, strong coverage, and minimal leverage provide a solid foundation for continued distributions, even if dividend growth slows in the near term.
However, the investment case is complicated by valuation and emerging operational risks. The stock trades close to its estimated intrinsic value, leaving limited margin for safety. At the same time, declining margins and certain financial indicators warrant careful monitoring.
For long-term income investors, Dynacor offers a stable dividend supported by strong financial fundamentals. For valuation-focused investors, however, the current share price may not offer sufficient upside to justify aggressive accumulation.
In its current position, Dynacor appears best characterized as a fundamentally strong company trading near fair value—an appealing holding for existing shareholders but one that may require either earnings acceleration or a price pullback to become a more compelling entry opportunity.