
Diversified Royalty Corp: High Yield, Thin Coverage
Attractive Income Offset by Structural Value Creation Challenges

Investment Thesis: Elevated Income Appeal Confronts Capital Efficiency and Valuation Constraints
Diversified Royalty Corp DIV 0.00%↑ is structured as a multi-royalty vehicle focused on acquiring predictable and growing royalty streams from multi-location businesses and franchisors across North America. All operating revenue is derived from royalties and management fees from its Royalty Partners, creating a relatively asset-light model centered on contractual cash flows.
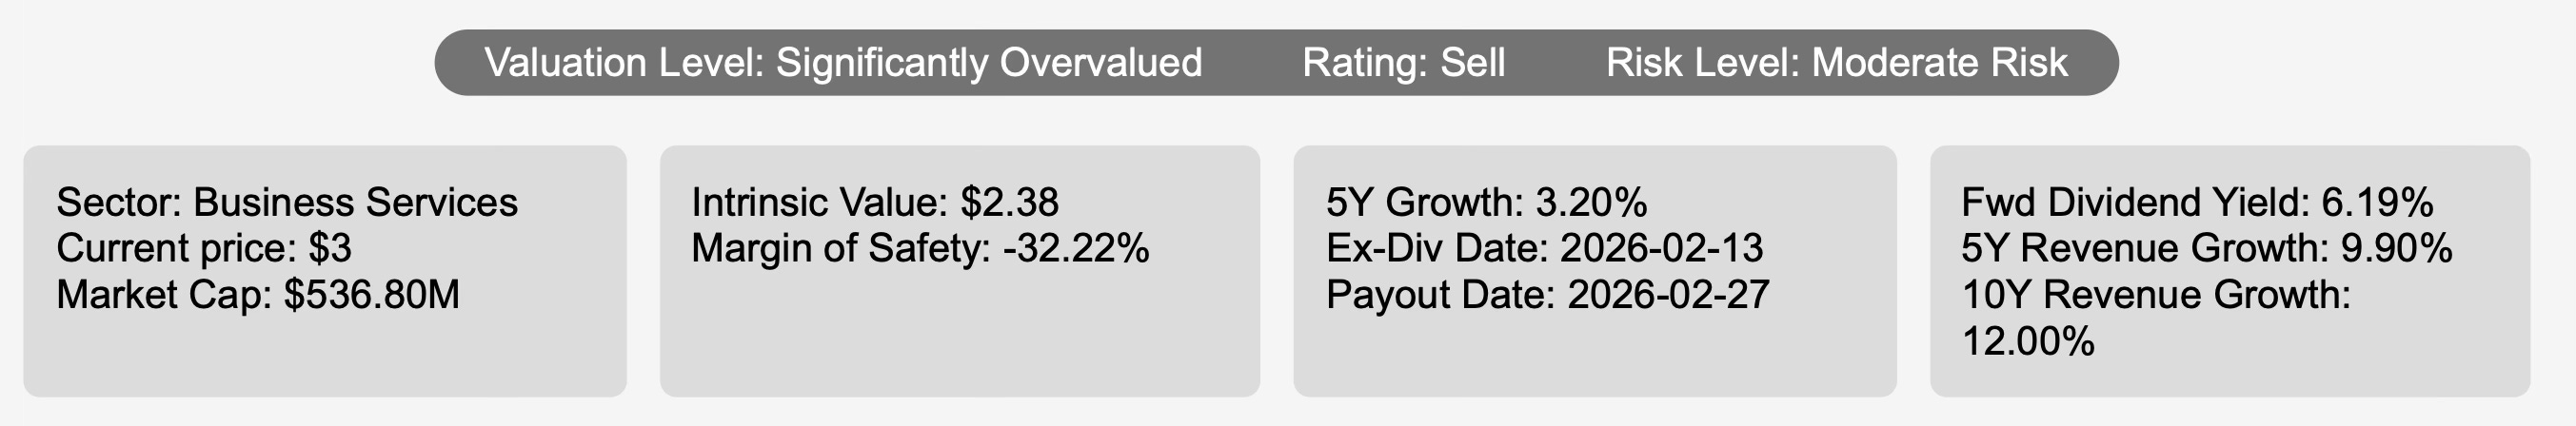
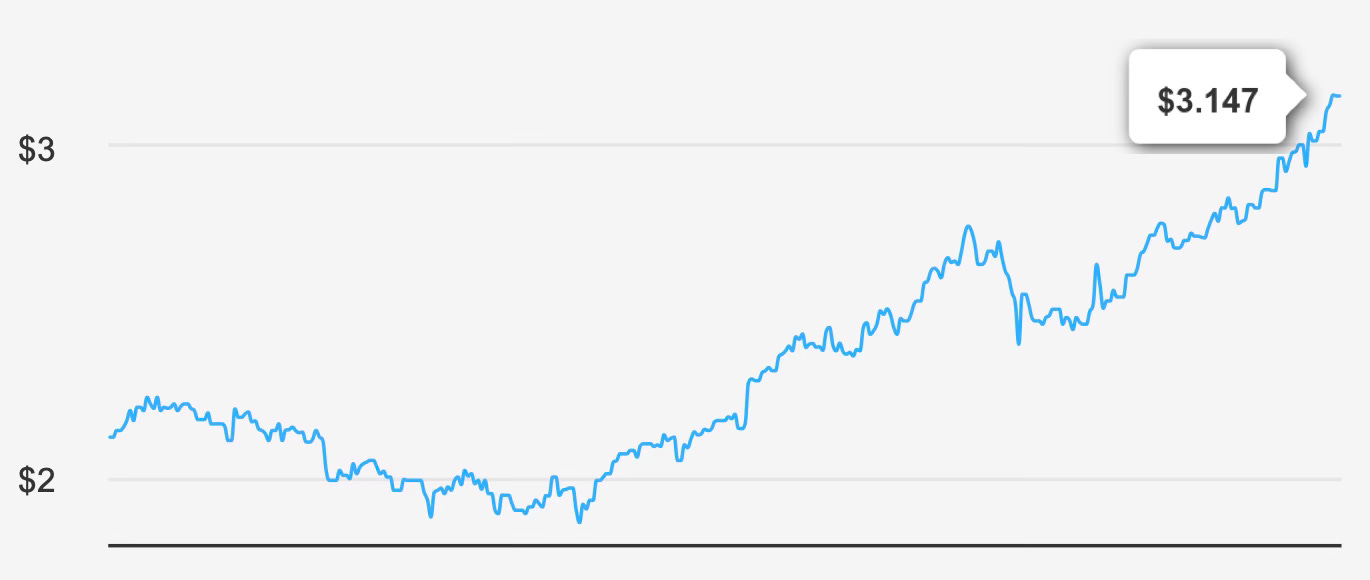
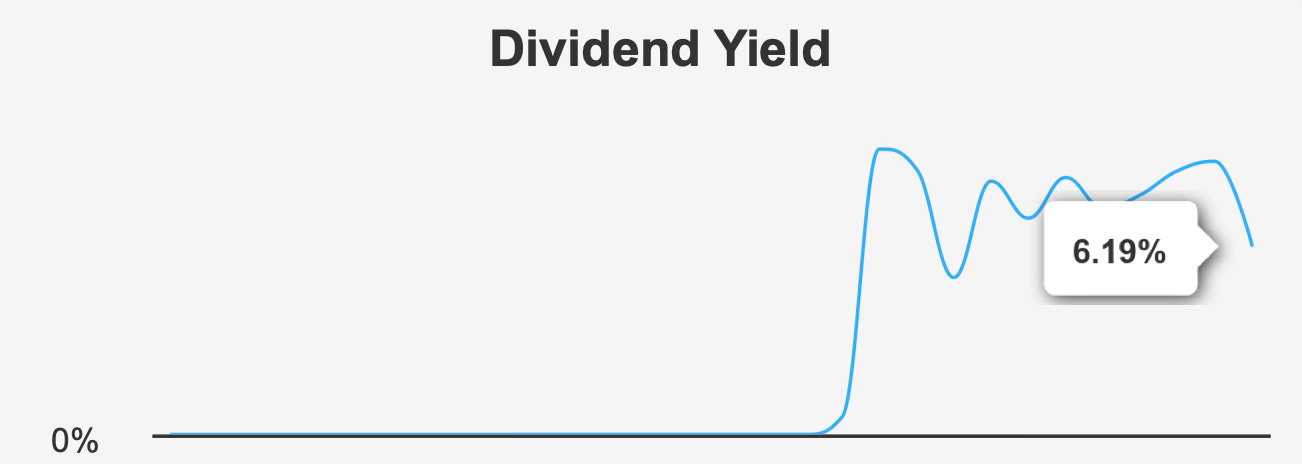
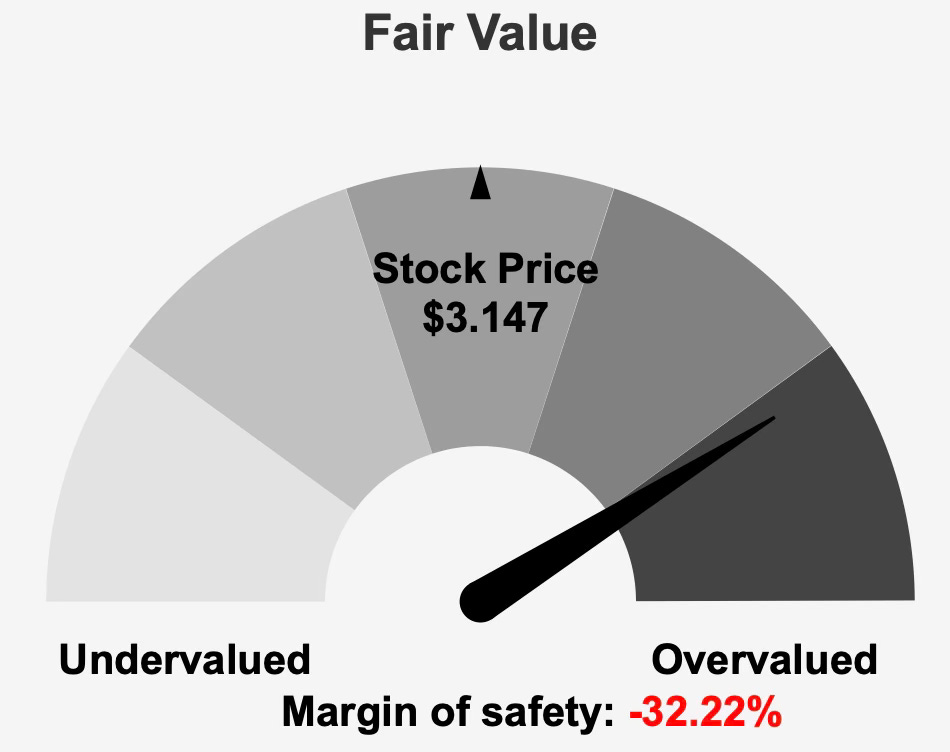
At a current share price of $3.00 and a market capitalization of $536.8 million, the stock offers a forward dividend yield of 6.2%. On the surface, that income profile is compelling. However, the company’s intrinsic value is calculated at $2.38, implying a negative margin of safety of -32.2%. The shares therefore trade meaningfully above assessed fair value.
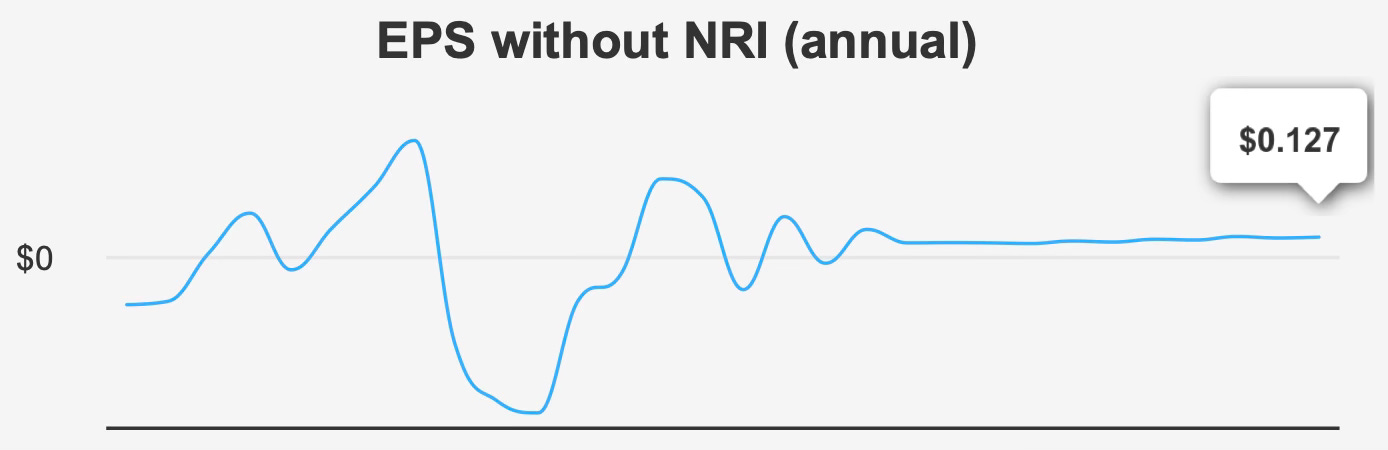
Over the past five years, revenue has compounded at 9.9%, with 10-year revenue growth averaging 12.0%. Earnings growth has been more modest. Annual EPS without non-recurring items has grown at a 7.6% CAGR over five years, but only 1.6% over ten years. This divergence highlights the structural reality of the model: while top-line royalty streams can expand steadily, earnings accretion is moderated by financing costs and capital structure.
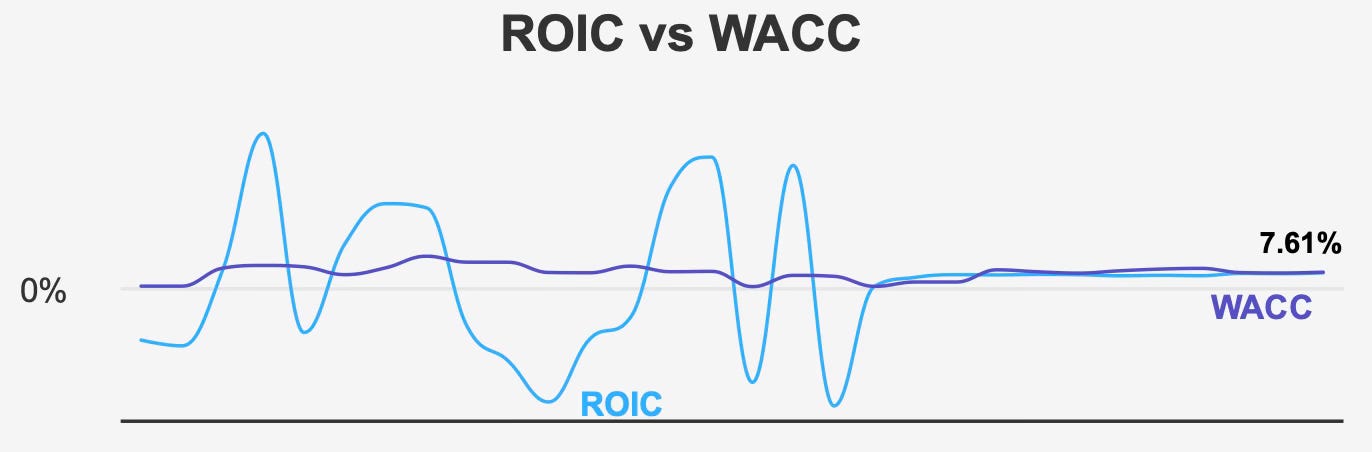
The more structural concern lies in economic value creation. The current Return on Invested Capital stands at 7.7%, slightly above the 10-year median of 6.4%, but still below the current Weighted Average Cost of Capital of 8.0%. When a business consistently earns less than its cost of capital, growth does not necessarily translate into value creation. Historically, the five-year median ROIC of 6.2% compared with a WACC median of 8.8% reinforces this pattern.
The investment case therefore centers on income durability rather than capital appreciation. Investors are effectively being compensated for elevated leverage and capital efficiency constraints with a high dividend yield. Whether that trade-off is acceptable depends on one’s tolerance for payout risk and valuation compression.
2. Earnings Momentum & Profitability Trends
In the most recent quarter ended September 30, 2025, EPS excluding non-recurring items was $0.033, flat sequentially and modestly higher than $0.030 in the prior year period. Revenue per share was $0.077, unchanged from the previous quarter and up from $0.071 year over year. The stability reflects the contractual nature of royalty income, but it also underscores limited near-term operating leverage.
Over five years, EPS without non-recurring items has compounded at 7.6%, indicating measured earnings expansion. The longer 10-year CAGR of 1.6% suggests that earnings growth has been uneven across cycles. Revenue growth has outpaced EPS growth, implying either higher financing costs, dilution, or structural margin constraints.
Notably, the company reports a gross margin of 0%, consistent across historical medians and highs. While this reflects the accounting structure of royalty income rather than traditional product margins, it reinforces the narrow spread available to absorb financing costs and administrative expenses.
Share repurchases have not contributed meaningfully to EPS expansion. Over the past decade, the buyback ratio stands at -6.3%, indicating no sustained reduction in share count. As a result, per-share growth has relied primarily on incremental royalty acquisitions rather than capital return optimization.
Looking forward, analyst estimates project revenues reaching $62.08 by 2027. EPS is forecast at $0.154 next fiscal year and $0.169 the following year. If achieved, that would support mid-single-digit to high-single-digit earnings growth, broadly consistent with the company’s five-year track record.
However, earnings expansion alone does not resolve the capital efficiency gap. With ROIC at 7.7% and WACC at 8.0%, incremental growth must either improve returns on invested capital or reduce financing costs to create sustainable shareholder value.
3. Dividend Profile & Sustainability
The dividend is the central pillar of the investment case. The company recently maintained its quarterly dividend at CAD 0.02375 per share, up from CAD 0.02292 in the prior quarter. The five-year dividend growth rate is 3.2%, accelerating to 6.3% over the past three years.
The forward dividend yield stands at 6.2%, placing the stock among higher-yielding names in its sector. The next ex-dividend date is February 13, 2026, with payment scheduled for February 27, 2026.
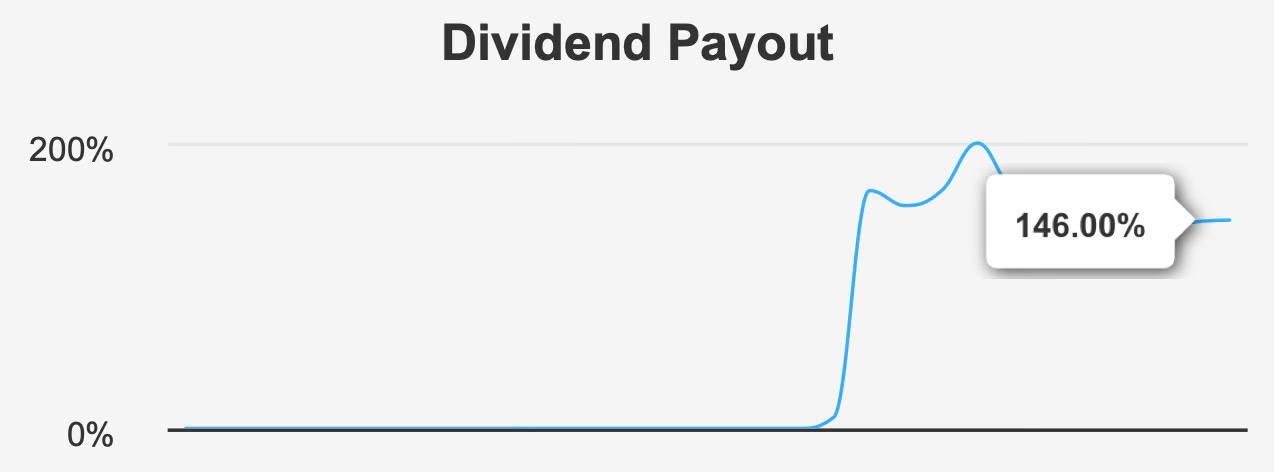
The challenge lies in coverage. The dividend payout ratio is 146%, well above the 10-year high of 102%. A payout ratio above 100% indicates that dividends exceed earnings, requiring external financing, balance sheet flexibility, or non-recurring cash sources to bridge the gap. Dividend coverage is reported at 0.66, reinforcing the limited cushion.
Leverage compounds the issue. Debt-to-EBITDA stands at 5.0x, exceeding the typical 4.0x threshold often associated with comfortable credit flexibility. Over the last three years, the company has issued CAD 89.472 million in long-term debt. Elevated leverage constrains refinancing flexibility and increases sensitivity to interest rate conditions.
Additional financial risk indicators warrant attention. The Piotroski F-Score is 3, suggesting weak fundamental momentum. The Altman Z-score of 1.56 places the company in the distress zone, implying heightened financial vulnerability over a two-year horizon. While the Beneish M-Score of -2.47 indicates a low likelihood of earnings manipulation, accounting integrity does not offset balance sheet risk.
Management forecasts dividend growth of 19.6% over the next three to five years. Achieving that level of expansion would require meaningful earnings growth, improved capital efficiency, or a recalibrated payout ratio. Without improvement in coverage metrics, the current dividend trajectory appears dependent on continued access to capital markets.
In short, the yield is attractive, but sustainability hinges on earnings normalization and balance sheet discipline.
4. Valuation: Premium Trading Levels Despite Limited Margin of Safety
At $3.15, the shares trade materially above the intrinsic value estimate of $2.38, implying a negative margin of safety of -32.4%. Even at the $3.00 current price cited in the overview, the discount to intrinsic value remains substantial.
The trailing P/E ratio is 25.3x, almost identical to the 10-year median of 25.3x. On a historical basis, the stock appears aligned with its long-term earnings multiple. The forward P/E of 19.6x suggests that projected earnings growth could compress the multiple modestly. However, this assumes estimates materialize and capital costs remain manageable.
The EV/EBITDA multiple of 17.5x sits slightly above the 10-year median of 16.9x. This places the stock at the higher end of its historical valuation range, though not dramatically so. The Price-to-Sales ratio of 10.6x exceeds the 10-year median of 9.8x, indicating a premium relative to revenue.
The Price-to-Book ratio stands at 2.5x, at its 10-year high. When valuation multiples approach historical peaks while ROIC remains below WACC, the risk of multiple compression increases.
One notable data point is the trailing Price-to-Free-Cash-Flow ratio of 0.0. This suggests either limited free cash flow generation or accounting complexities that obscure underlying cash economics. For a dividend-oriented investment, clarity on free cash flow is critical.
Taken together, valuation metrics do not provide a cushion. The stock trades at or above historical norms despite sub-cost-of-capital returns and elevated leverage. Without a clear inflection in capital efficiency, upside appears constrained relative to downside risk.
5. Risk Assessment & Capital Structure Considerations
Financial leverage is central to the risk profile. A Debt-to-EBITDA ratio of 5.0x reduces flexibility and increases sensitivity to refinancing conditions. With ROIC below WACC, incremental borrowing does not currently create economic value.
Liquidity considerations add another layer of complexity. Daily trading volume averages 3,702 shares, well below the two-month average of 12,233 shares. Lower liquidity can amplify volatility and widen bid-ask spreads, particularly for larger investors.
Dark pool data shows 44% buy-side activity versus 56% sell-side activity. While not definitive, the tilt toward selling suggests cautious institutional sentiment.
Insider ownership is reported at 0%, and there has been no insider trading activity in the past three, six, or twelve months. Institutional ownership stands at 13.7%. The absence of insider equity participation may raise alignment questions, particularly for income-focused shareholders assessing long-term stewardship.
On the positive side, government contract awards have increased from $500,000 in 2020 to $1,000,000 in 2023, with projections of $1,200,000 in 2025. Patent growth has also expanded from 12 in 2018 to 54 in 2023. These developments signal incremental business expansion, though their direct impact on per-share economics remains modest relative to balance sheet scale.
Overall, the capital structure is workable but tight. Sustained dividend payments at current levels require stable royalty inflows and disciplined capital management.
Final Assessment
Diversified Royalty Corp offers a forward yield of 6.2% supported by steady royalty income and moderate revenue growth. Five-year EPS growth of 7.6% and projected earnings expansion provide some underpinning for dividend continuity.
However, the structural challenges are difficult to overlook. A 146% payout ratio, 5.0x leverage, and ROIC below WACC constrain financial flexibility. The stock trades above intrinsic value with a negative margin of safety and valuation multiples near historical highs.
For income-focused investors comfortable with leverage and limited margin of safety, the yield may justify selective exposure. For more conservative dividend investors prioritizing coverage strength, capital efficiency, and valuation discipline, the risk-reward profile appears unbalanced.
At current levels, the shares reflect optimism about continued growth without fully compensating for financial and valuation risk. A more attractive entry point—closer to intrinsic value and supported by improved coverage metrics—would materially strengthen the long-term dividend case.