
Chartwell Retirement Residences: Dividend Stability Facing Structural Profitability Challenges
Income Consistency in a Capital-Intensive Retirement Housing Business

1. Investment Thesis: Balancing Stable Retirement Housing Cash Flows Against Persistent Capital Efficiency Constraints
Chartwell Retirement Residences operates one of the largest retirement residence platforms in Canada, owning and managing senior living communities that provide housing and lifestyle services to an aging population. The trust generates the majority of its revenue from retirement residences it owns and operates, with pricing determined by service levels, care requirements, and prevailing market conditions.
At a high level, the investment case rests on a familiar theme within real estate investment trusts: stable demand, recurring revenue streams, and demographic tailwinds tied to population aging. Senior housing tends to exhibit relatively predictable occupancy levels, and the essential nature of care-oriented housing can create durable long-term demand.
Yet the financial profile of Chartwell introduces several structural challenges that complicate the otherwise stable operating narrative.
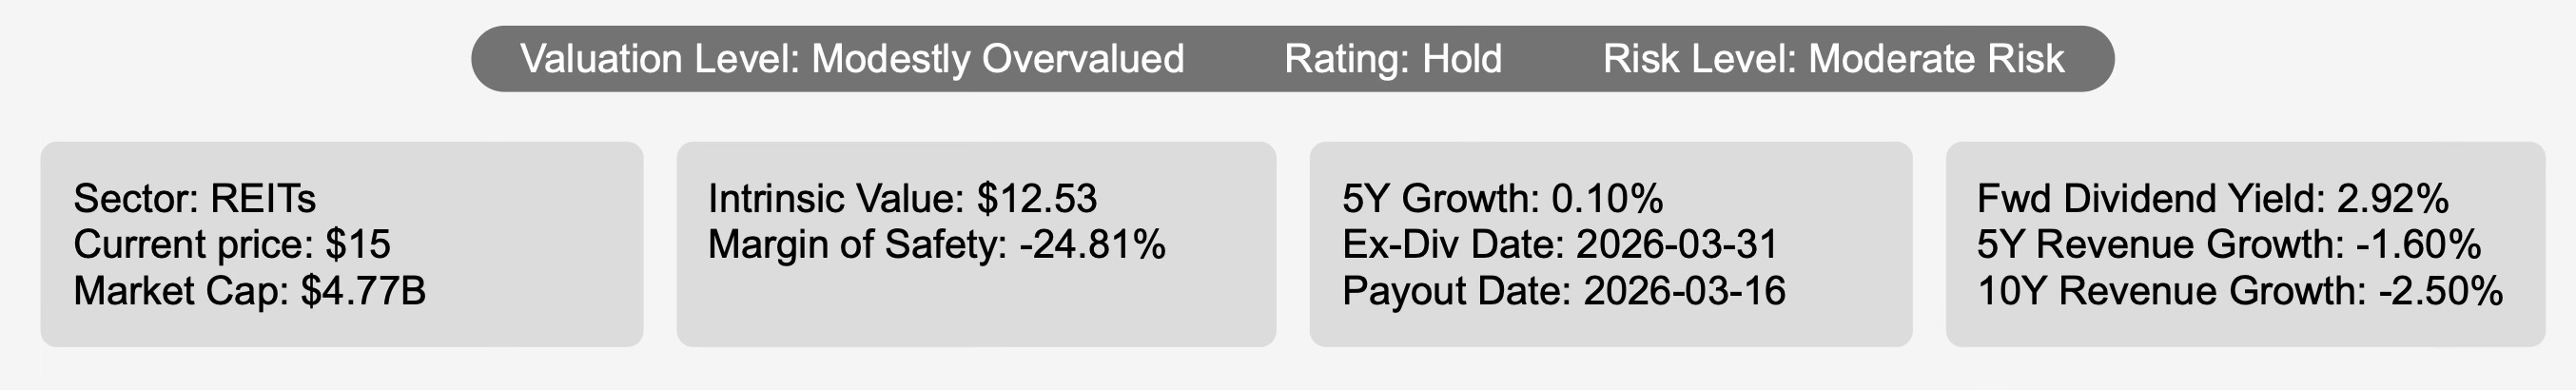
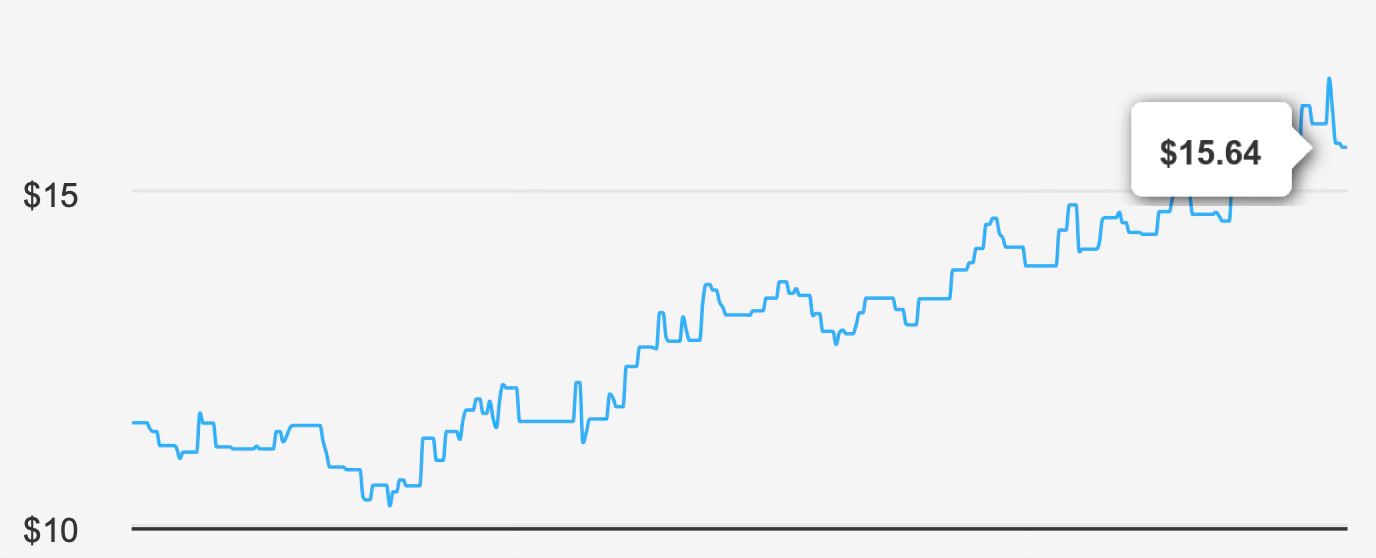
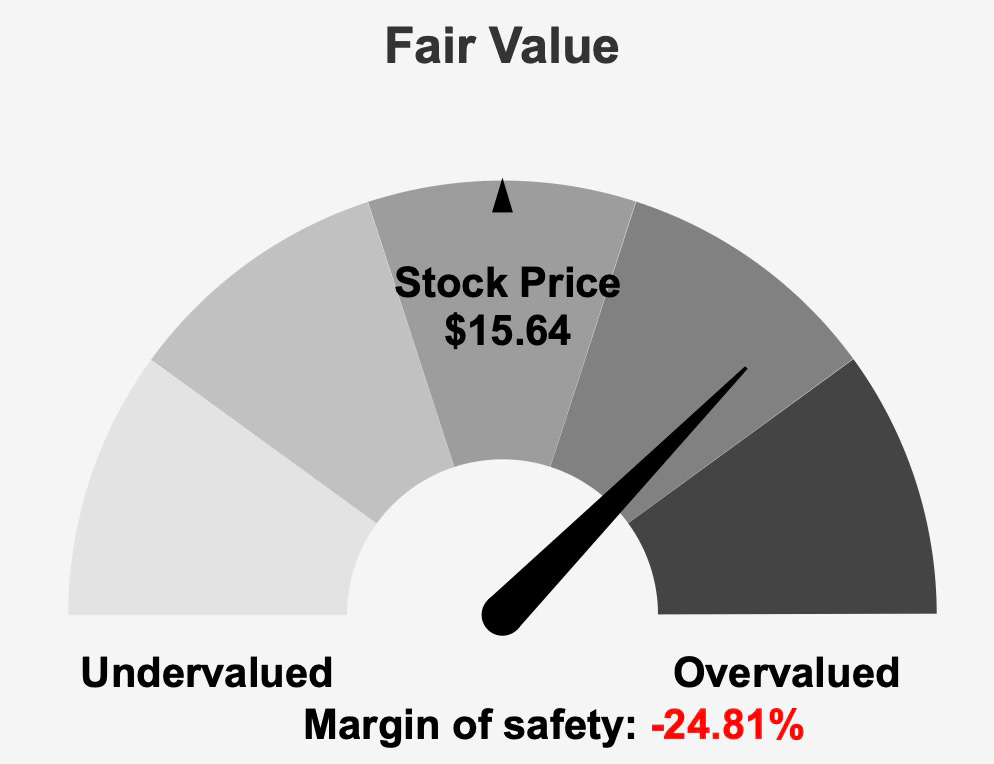
The trust currently carries a market capitalization of roughly $4.77 billion and trades near $15 per share. However, intrinsic valuation estimates suggest a fair value closer to $12.53, leaving investors with a negative margin of safety of approximately 24.8%. In other words, the market price appears to incorporate expectations of future improvement that may not yet be fully reflected in the company’s historical financial performance.
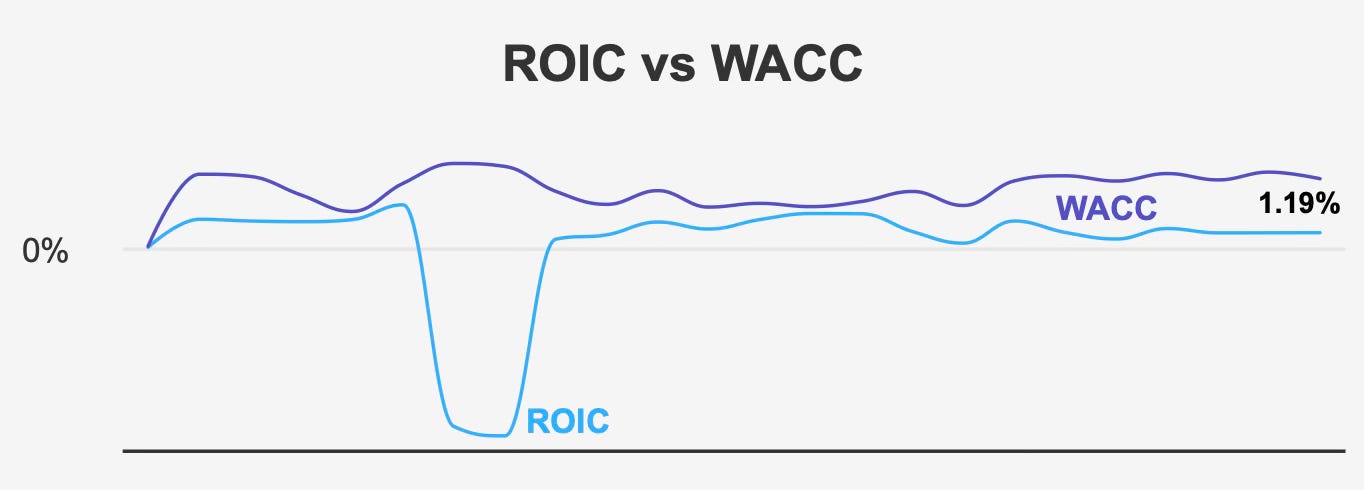
The central issue within the investment thesis lies in capital efficiency. Over the past five years, Chartwell has generated a median return on invested capital of about 1.2%, while its weighted average cost of capital sits around 6.2%. This gap indicates that the business has not consistently produced returns sufficient to exceed its cost of capital.
Even during stronger periods, returns have remained relatively modest. The highest recorded return on invested capital over the past decade reached roughly 2.9%, still well below the cost of capital.
From a shareholder perspective, this dynamic is significant. When a company’s returns consistently fall short of its cost of capital, value creation becomes difficult. Capital deployed into new projects or property expansions may increase revenue but may not necessarily translate into meaningful shareholder value.
Despite these structural limitations, the operating platform itself remains stable. The company continues to benefit from demographic demand drivers and improving operating margins, while analysts project a gradual recovery in earnings over the next several years.
Consensus estimates currently place earnings per share near $0.218 for the upcoming fiscal year and roughly $0.276 the following year. If realized, this improvement could support greater financial stability and help narrow the gap between operational performance and investor expectations.
In short, the investment thesis for Chartwell Retirement Residences revolves around balancing dependable senior housing operations against structural profitability constraints and a valuation that already reflects optimism about future improvement.
2. Earnings Momentum and Profitability Trends in a Gradually Improving Operating Environment
Recent financial results indicate incremental operational progress, though the longer-term growth trajectory remains uneven.
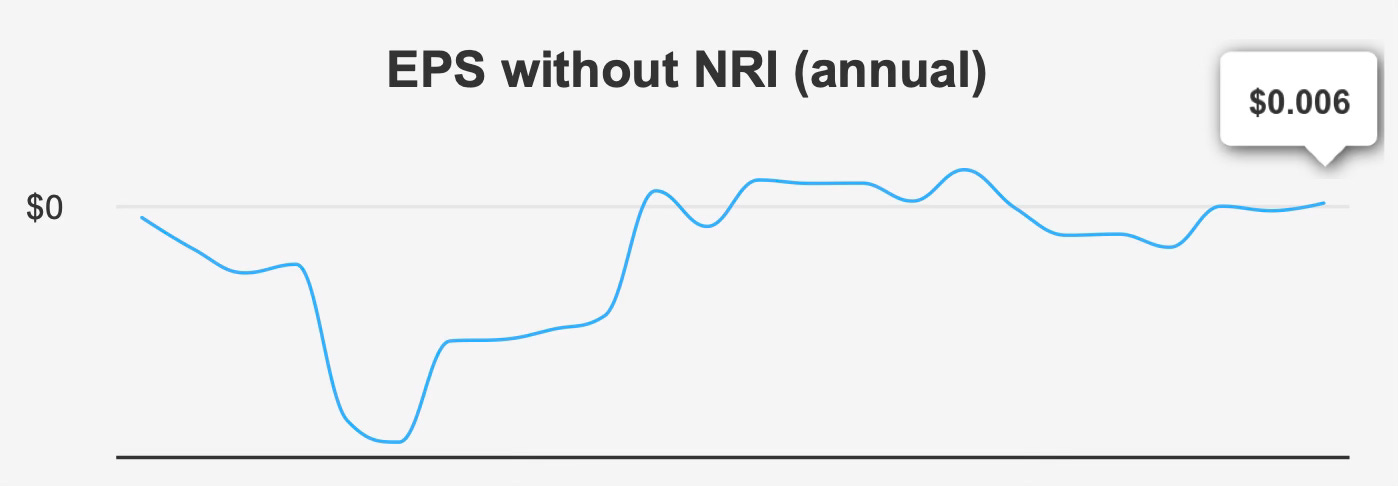
In the fourth quarter of 2025, earnings per share excluding non-recurring items reached $0.002. This represented an improvement from the previous quarter’s loss of $0.001 but remained below the $0.009 reported during the same quarter a year earlier.
Reported diluted earnings per share showed a stronger recovery. Diluted EPS rose to $0.017, rebounding from a loss of $0.013 in the prior quarter and exceeding the $0.009 recorded in the comparable period of the previous year. This improvement suggests that operating performance has begun to stabilize following recent volatility.
Revenue trends reinforce this gradual recovery. Revenue per share increased to $0.709, up from $0.67 in the previous quarter and $0.596 in the same period last year. The upward trajectory suggests improved occupancy levels or pricing adjustments across the company’s retirement residence portfolio.
However, when viewed across longer time horizons, the company’s growth profile remains relatively subdued.
Over the past five years, earnings excluding non-recurring items have grown at an annual rate of approximately 14%. While this figure appears strong, the longer-term trend is far less impressive. Over a ten-year period, earnings growth has effectively remained flat.
Revenue trends also illustrate the challenge. Over the past five years, revenue has declined at an average rate of about 1.6% annually. Over the past decade, the decline averages roughly 2.5% per year.
These figures highlight an important distinction between short-term operational improvements and structural growth within the business. While the company has recently demonstrated improving margins and stronger quarterly performance, long-term revenue expansion has been limited.
One area where management has achieved measurable improvement is cost efficiency. The company’s gross margin recently reached 40.9%, the highest level recorded over the past decade. This compares favorably with the five-year median margin of approximately 37.3%, suggesting improved operating discipline and pricing strategies.
Share repurchase activity has also contributed modestly to per-share earnings growth. Over the past year, the company reduced its share count by roughly 11.5%. Over the past decade, share repurchases have averaged approximately 4.4% annually.
While buybacks can enhance earnings per share, they do not fundamentally change the underlying economics of the business. Sustained growth ultimately requires stronger revenue expansion and improved returns on invested capital.
Looking ahead, analysts expect moderate top-line improvement. Revenue is projected to reach approximately $961.9 million in 2026 and roughly $1.02 billion in 2027. These projections align broadly with industry expectations, as the retirement living sector is forecast to grow around 3.5% annually over the coming decade.
Overall, Chartwell’s earnings profile reflects incremental operational improvement within a sector that tends to grow slowly and requires significant capital investment.
3. Dividend Profile and Sustainability of Monthly Income Distributions
For many investors, the primary attraction of Chartwell Retirement Residences lies in its dividend program.
The trust distributes dividends on a monthly basis, providing a consistent income stream that appeals to income-focused investors. The forward dividend yield currently stands near 2.8%, offering regular distributions though at a level somewhat below many higher-yielding REIT sectors.
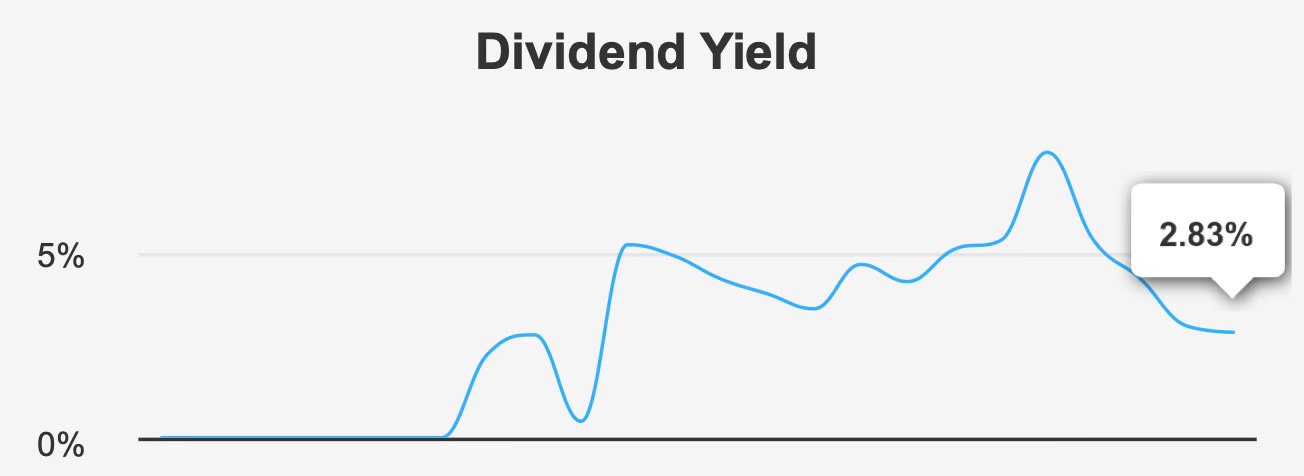
While the dividend has remained stable, growth has been minimal. Over the past three years, the dividend per share has not increased, and over the past five years the growth rate stands at just 0.1%.
This stagnation suggests that management’s priority has been preserving the payout rather than expanding it. In mature real estate businesses, stable dividends can be attractive, but long-term dividend investors typically prefer companies capable of generating consistent payout growth.
More concerning is the relationship between dividends and earnings.
The company’s current dividend payout ratio stands at approximately 7,350%. Such an elevated figure reflects the fact that dividend payments significantly exceed reported earnings.
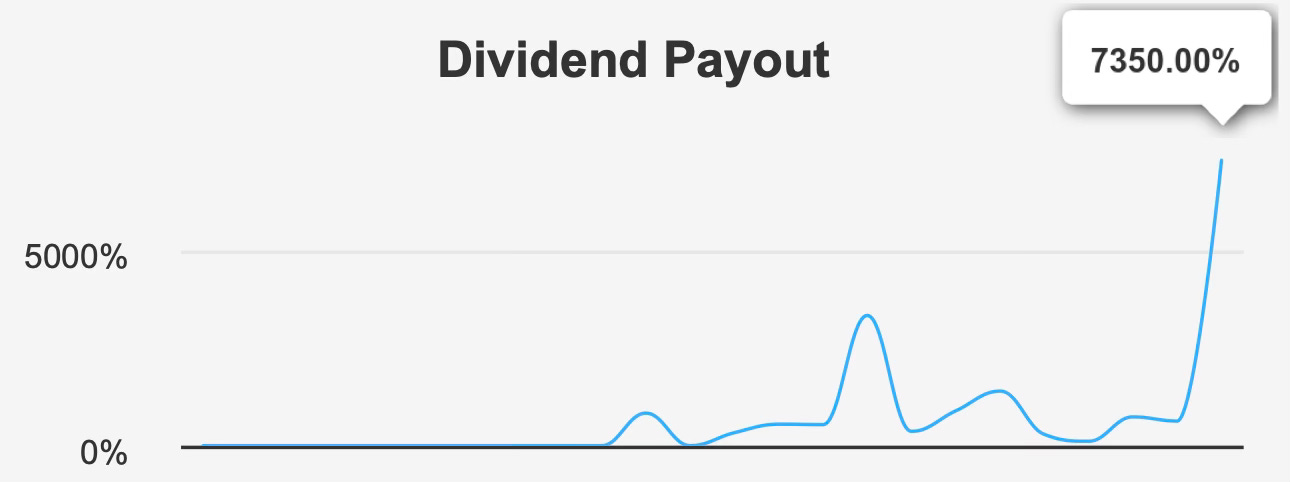
Historically, the payout ratio has typically ranged between roughly 101% and 173%, with a median near 106%. Even these historical levels indicate a payout policy that distributes nearly all available earnings to shareholders.
Dividend coverage metrics reinforce the challenge. The current coverage ratio sits near 0.16, meaning earnings cover only a small fraction of the dividend.
While real estate trusts often rely on cash flow metrics rather than traditional earnings, such limited coverage still warrants attention. If operating conditions weaken or financing costs rise, maintaining the current dividend could become more difficult.
Financial leverage further complicates the picture. The company’s debt-to-EBITDA ratio stands around 6.8, significantly above the commonly referenced threshold of roughly 4.0.
Higher leverage can amplify returns during favorable operating conditions but may also constrain flexibility during economic downturns or periods of rising interest rates.
Despite these challenges, the company has maintained its dividend distribution and continues to provide monthly payments to investors. For income-focused portfolios prioritizing stability over growth, this payout structure may still hold appeal.
However, long-term dividend sustainability ultimately depends on the company’s ability to strengthen earnings and maintain disciplined capital management.
4. Valuation Analysis: Assessing Market Pricing Relative to Intrinsic Value and Historical Multiples
Valuation metrics suggest that the market currently prices Chartwell shares with relatively optimistic expectations.
The stock trades near $15.64 per share, compared with an estimated intrinsic value of $12.53. This difference represents a negative margin of safety of roughly 24.8%, indicating that investors are paying a premium relative to the modeled fair value.
Earnings-based valuation metrics appear elevated as well.
The forward price-to-earnings ratio currently sits around 71.7x. While this represents a significant improvement from the trailing price-to-earnings ratio of approximately 217.2x, both figures remain high for a company with modest long-term growth.
For additional context, the company’s ten-year median P/E ratio stands near 142.7x. Even relative to its own historical trading range, the current valuation remains demanding.
Enterprise value metrics reinforce this view. The trailing EV/EBITDA ratio is roughly 21.9x, slightly above the ten-year median multiple of about 20.1x but below the historical peak of 29.1x.
The price-to-book ratio also reflects a premium valuation. At approximately 3.9x, the multiple exceeds the ten-year median of roughly 3.5x.
One metric that appears somewhat more favorable is the price-to-free-cash-flow ratio. At roughly 35.2x, the multiple sits well below the ten-year median of approximately 77.7x, suggesting that cash flow generation may be improving relative to past periods.
Still, when viewed collectively, the company’s valuation metrics indicate that investors are paying a relatively high price for a business that has historically produced limited growth and modest returns on capital.
Without a clear margin of safety, the stock’s future performance will likely depend heavily on operational improvements and continued earnings recovery.
5. Risk Assessment and Capital Structure Considerations
Several financial and structural risks shape the overall investment profile of Chartwell Retirement Residences.
The company has issued approximately CAD 201.97 million in long-term debt over the past three years, reflecting a reliance on borrowing to support operations and expansion.
High leverage increases financial sensitivity to interest rates and economic conditions. Combined with a debt-to-EBITDA ratio of nearly 6.8, the capital structure leaves limited room for operational missteps.
Balance sheet metrics also indicate elevated financial risk. The company’s Altman Z-score stands near 1.39, placing it within the distress zone and implying an increased probability of financial strain over the next several years.
Profitability metrics further highlight the challenge. With returns on invested capital consistently below the weighted average cost of capital, the company has historically struggled to generate economic value from its investments.
Dividend sustainability also remains a potential concern given the extremely high payout ratio and limited earnings coverage.
Governance dynamics add another layer of consideration. Insider ownership currently stands at 0%, meaning company management and directors hold no direct equity stake in the business.
Institutional investors hold approximately 28% of shares, suggesting moderate institutional confidence but not overwhelming conviction.
Finally, liquidity conditions may affect trading dynamics. Daily trading volume has recently fallen well below the two-month average, which could lead to wider bid-ask spreads and increased price volatility.
Final Assessment
Chartwell Retirement Residences presents a mixed investment profile for dividend-oriented investors.
On one hand, the company operates within a sector supported by long-term demographic trends and provides a consistent monthly dividend that may appeal to income-focused portfolios. Recent improvements in operating margins and expectations for gradual earnings growth suggest that the business is stabilizing.
On the other hand, structural challenges remain difficult to ignore. The company has historically generated returns on capital well below its cost of capital, revenue growth has been limited, and the current dividend payout significantly exceeds earnings coverage.
Valuation further complicates the picture. With the stock trading above its estimated intrinsic value and at elevated earnings multiples, investors currently receive little margin of safety.
Taken together, Chartwell appears best suited for investors seeking stable income rather than long-term capital appreciation. While the dividend may remain intact in the near term, the combination of high leverage, limited growth, and premium valuation suggests a cautious outlook.
For long-term dividend investors prioritizing sustainability and value creation, the stock currently warrants a neutral stance until clearer signs of improved profitability and capital efficiency emerge.