
Canadian Apartment Properties REIT: Income Stability with Capital Efficiency Questions
Dividend Stability Supported by Cash Flow, Tempered by Capital Structure Risk

Investment Thesis: A Diversified Canadian and European Residential REIT Trading Below Intrinsic Value but Facing Capital Efficiency Constraints
Canadian Apartment Properties Real Estate Investment Tru, commonly known as CAPREIT, owns and manages multi-unit residential rental properties concentrated in urban centres across Canada, with additional exposure in the Netherlands. The majority of income is generated from Canadian income-producing properties, anchoring the portfolio in stable, necessity-driven housing demand.
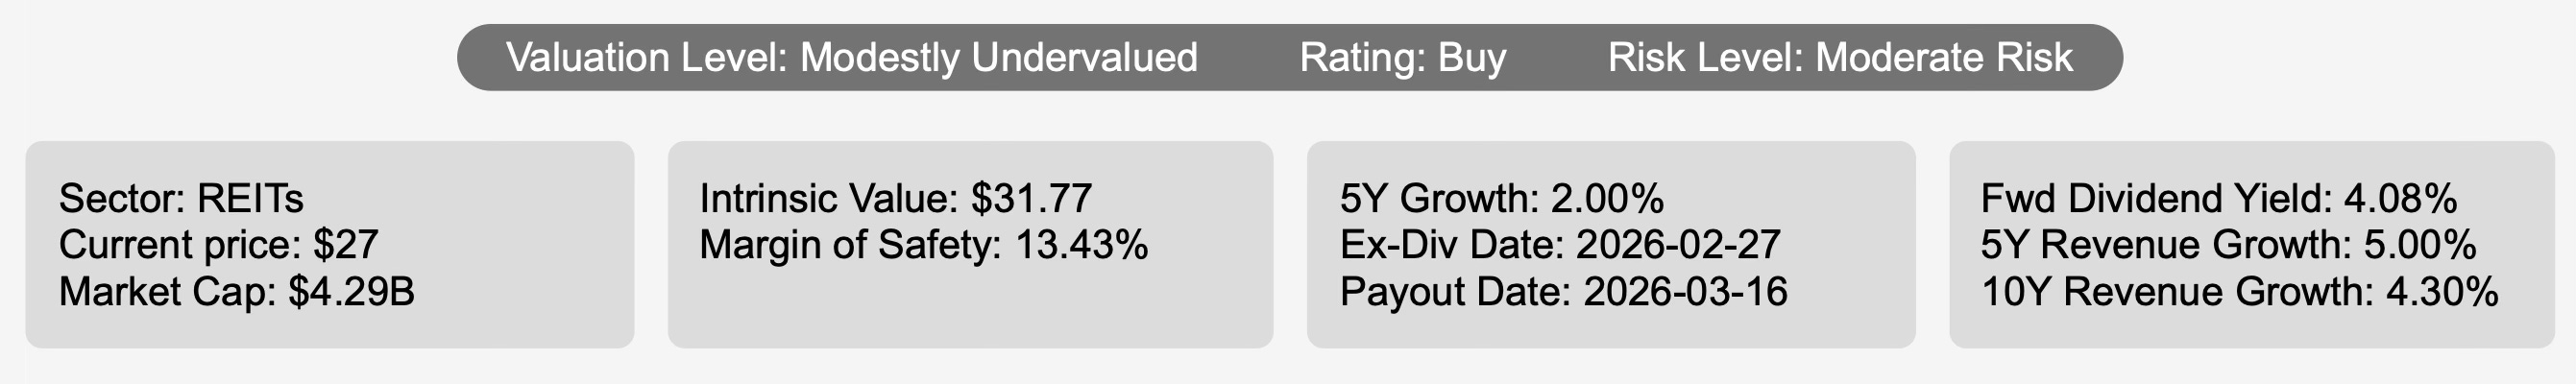
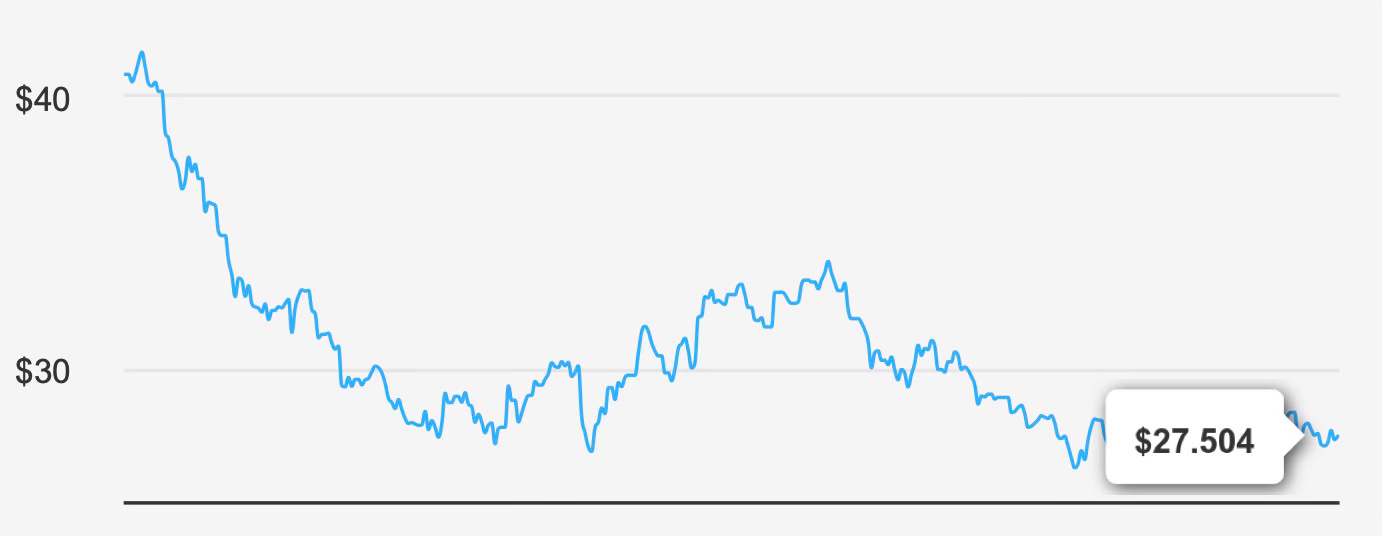
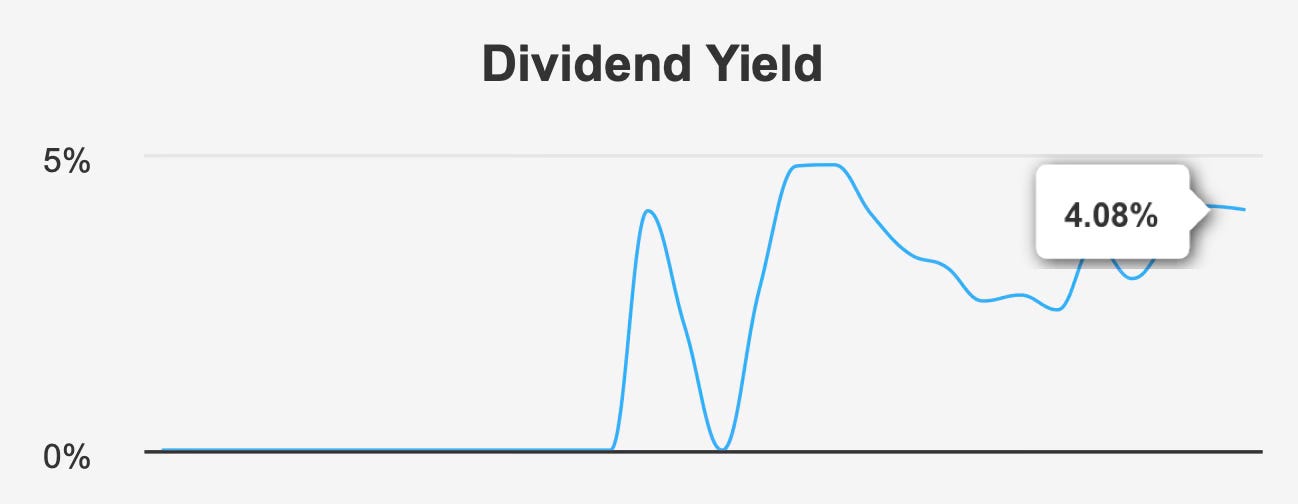
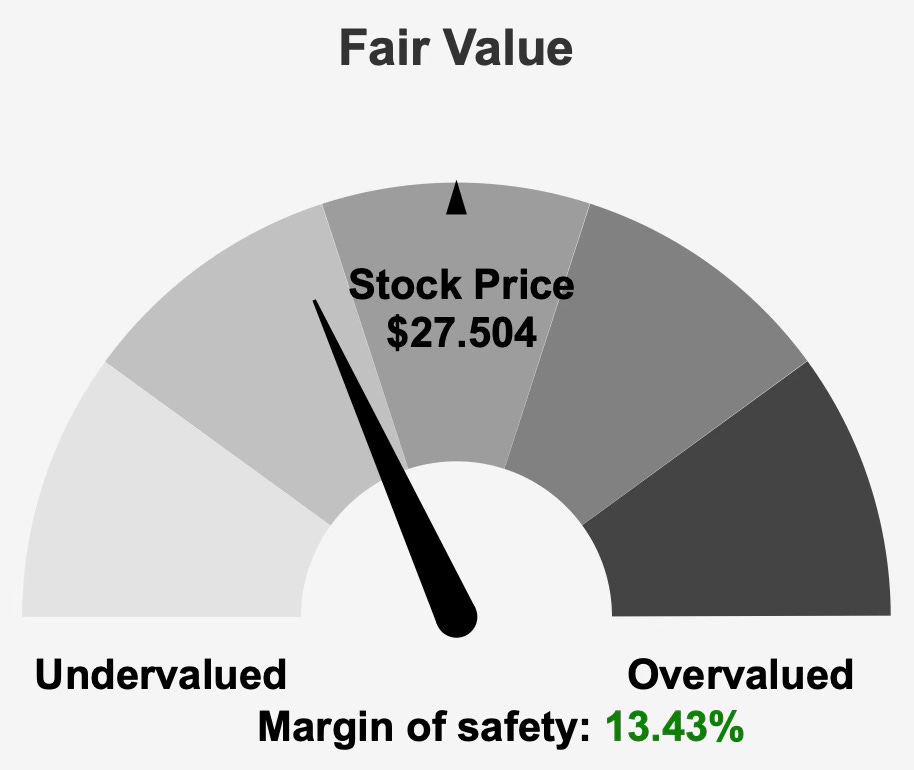
At a current share price of $27 and a market capitalization of $4.29 billion, the trust trades below its estimated intrinsic value of $31.77. This implies a margin of safety of 13.4%, positioning the equity as modestly undervalued on an intrinsic basis. The forward dividend yield of 4.1% adds income appeal, particularly within the REIT sector.
Revenue growth has been steady rather than aggressive. Over the past five years, revenue has expanded at a 5.0% annual rate, while the 10-year growth rate stands at 4.3%. These figures align with the broader industry forecast of roughly 4% annual growth over the next decade, suggesting that CAPREIT’s portfolio has largely tracked sector dynamics.
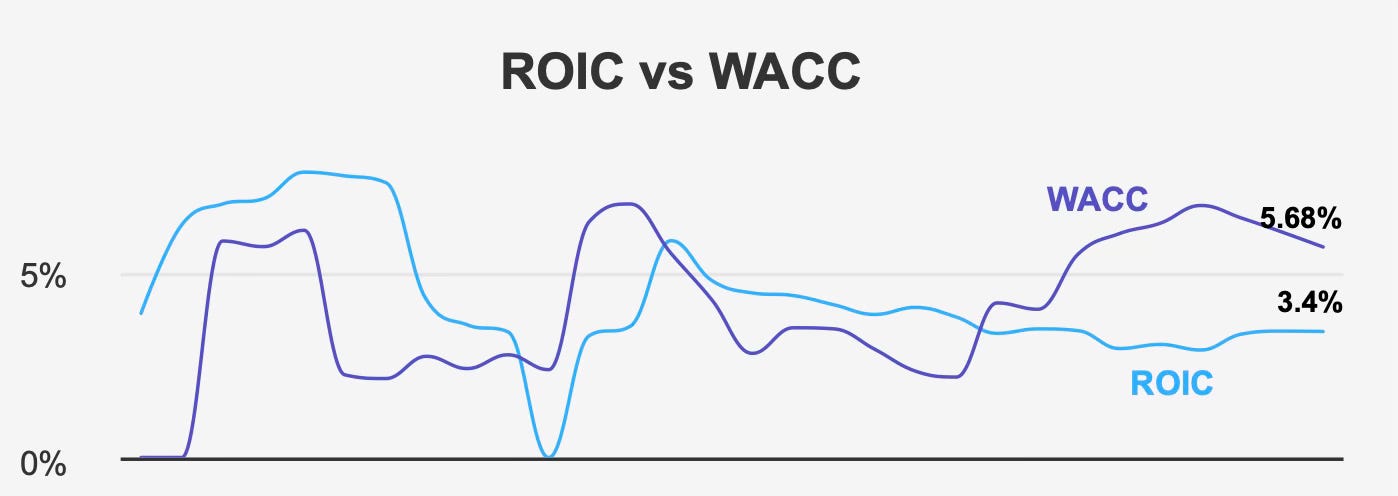
However, valuation support alone does not define the investment case. Returns on invested capital have consistently trailed the cost of capital. Recent ROIC stands at 3.4%, below the five-year median WACC of 6.3% and also below the current WACC of 5.7%. Although the spread has narrowed as WACC declined, economic value creation remains negative.
The thesis therefore rests on two balancing forces: moderate undervaluation and improving earnings momentum on one side, against structural leverage and capital efficiency challenges on the other. For income-focused investors, the durability of cash flows and the trajectory of returns on capital will determine whether the discount represents opportunity or compensation for risk.
Earnings Momentum & Profitability Trends
The most recent quarter, ending December 31, 2025, showed meaningful improvement in earnings performance. EPS excluding non-recurring items rose to $0.447, up from $0.255 in the prior quarter and well above $0.079 in the same period last year. Diluted EPS followed a similar path, increasing to $0.403 from $0.119 in Q3 2025 and reversing a negative $0.199 result in Q4 2024.
This sequential and year-over-year improvement suggests operational stabilization after a period of volatility. Revenue per share, however, slipped modestly to $1.121 from $1.149 in the prior quarter, indicating that earnings gains were not purely top-line driven.
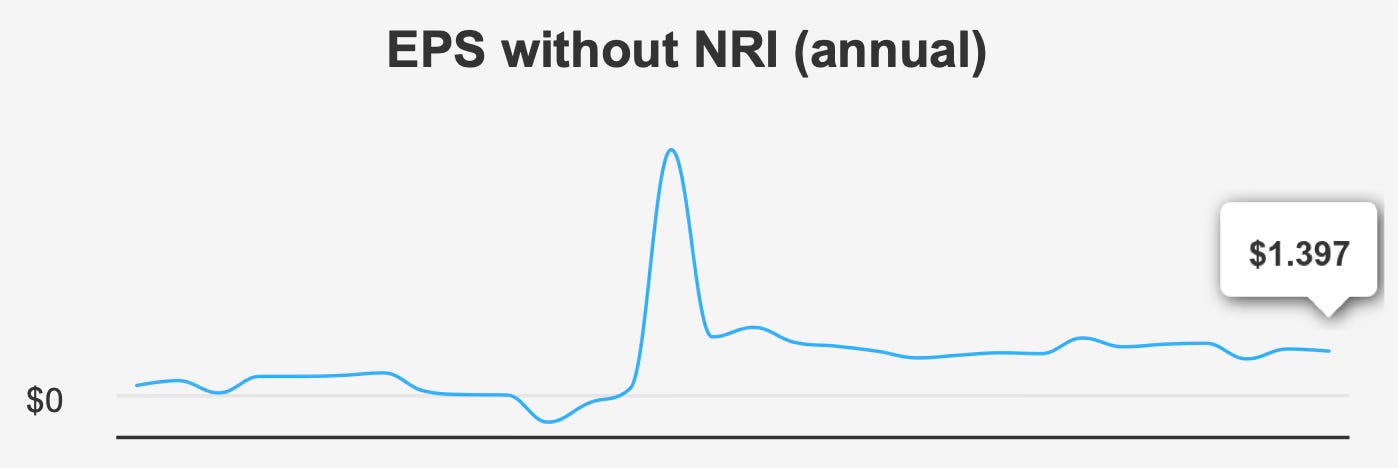
Longer-term trends remain mixed. Over the past five years, annual EPS excluding non-recurring items declined at a compound rate of 3.4%, reflecting earlier earnings pressure. Over ten years, EPS growth has been modest at 1.7% annually. The contrast between recent quarterly acceleration and subdued longer-term compounding underscores the importance of confirming that current gains are sustainable.
Margin stability supports the earnings rebound. Gross margin stands at 59.7%, consistent with the five-year median and only slightly below the 10-year high of 60.6%. In a residential REIT, stable margins indicate disciplined operating management and controlled property-level expenses.
Capital allocation has also shifted. Over the past year, the buyback ratio was 4.1%, meaning 4.1% of outstanding shares were repurchased. This contrasts sharply with the three-year median buyback ratio of negative 7.7%, which previously reflected net issuance. The move toward share reduction enhances per-share metrics and signals a more shareholder-focused capital deployment strategy.
Looking forward, analysts project revenue to reach $729.23 million by the end of 2026 and expand to $885.92 million by 2028. Earnings per share are estimated at $1.895 for FY1 and $1.975 for FY2. These projections suggest moderate expansion rather than rapid acceleration, consistent with a residential portfolio anchored in steady rent growth rather than cyclical upside.
Despite this improvement, capital efficiency remains the central issue. With ROIC at 3.4% and WACC at 5.7%, invested capital continues to earn below its cost. Over the long term, that gap constrains intrinsic value growth even if accounting earnings trend higher.
Dividend Profile & Sustainability
CAPREIT’s dividend profile reflects measured growth and reasonable coverage relative to sector norms. The forward yield stands at 4.1%, competitive within residential REITs and within the company’s historical yield range of 2.2% to 4.3%. The 10-year median yield of 3.1% suggests today’s payout is toward the higher end of its long-term distribution band.
Dividend growth has been modest but consistent. The five-year growth rate is 2.0%, with a slightly higher three-year rate of 2.1%. Forward growth is estimated at 4.9% over the next three to five years, implying gradual acceleration if earnings projections materialize.
The latest quarterly dividend was CAD 0.12917 per share, reflecting stable monthly distributions. The next ex-dividend date is February 27, 2026, with payment scheduled for March 16, 2026, in line with its monthly structure.
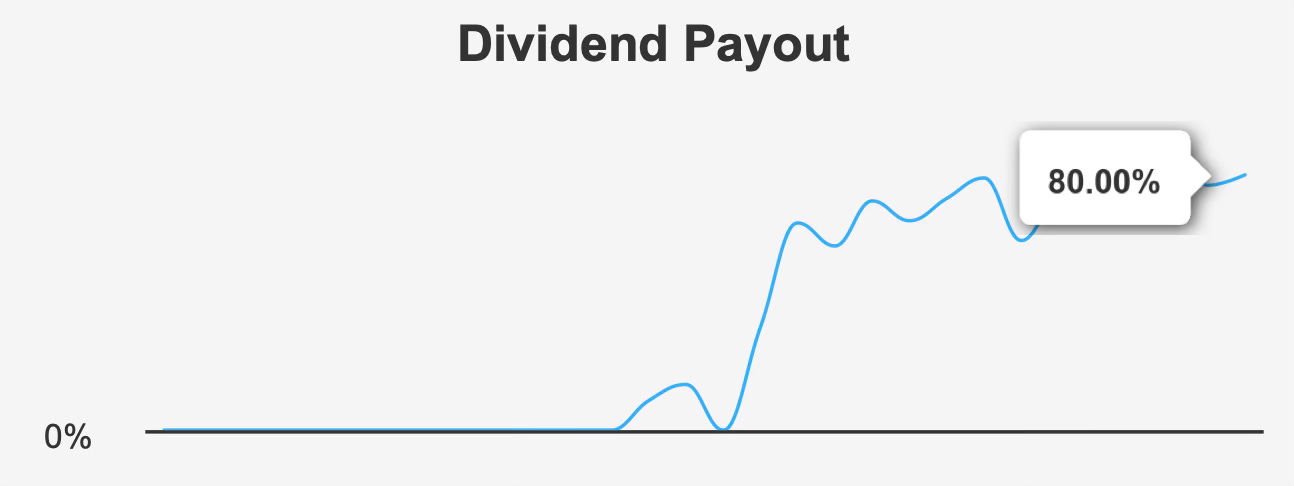
The payout ratio currently stands at 80.0%, an improvement from the 10-year high of 100.9% but still elevated. Dividend coverage is 0.8, indicating that earnings cover distributions, though without a wide margin of safety. In a capital-intensive business model, such coverage levels warrant careful monitoring, especially during periods of economic slowdown.
Leverage compounds this sensitivity. Debt-to-EBITDA is 14.9x, substantially above conventional caution thresholds around 4.0x. While REITs typically operate with higher leverage due to asset-backed financing structures, this level limits flexibility and increases refinancing exposure.
From a sustainability standpoint, the dividend appears stable but not immune to balance sheet constraints. Growth expectations of roughly 5% over the medium term depend on steady rent increases, disciplined cost control, and gradual improvement in capital returns.
Valuation: Intrinsic Discount Supported by Book Value Alignment but Offset by Elevated Enterprise Multiples
At $27 per share compared to intrinsic value of $31.77, CAPREIT trades at a 13.4% discount to estimated fair value. This modest margin of safety provides valuation support, particularly for income-oriented investors seeking yield with some downside buffer.
The forward P/E ratio of 14.6x contrasts with a trailing twelve-month P/E of 30.7x, reflecting expectations of improved earnings. However, the 10-year median P/E of 8.9x indicates that today’s multiple remains elevated relative to historical norms. This divergence suggests that while earnings recovery is anticipated, the market may already be pricing in a substantial portion of that improvement.
The price-to-book ratio of 0.7x sits below the 10-year median of 1.0x, implying that the equity trades at a discount to its historical book valuation. For a property-focused REIT with tangible assets, this metric provides tangible downside reference.
Enterprise valuation metrics tell a more cautious story. The TTM EV/EBITDA multiple stands at 29.4x, well above the 10-year median of 12.5x, though far below the historical peak of 240.4x. Elevated EV/EBITDA suggests the enterprise value remains stretched relative to operating earnings.
By contrast, the price-to-free-cash-flow ratio of 18.8x is below the 10-year median of 28.4x, indicating that cash flow valuation appears more reasonable compared to historical averages.
Taken together, valuation presents a nuanced picture. On intrinsic value and book metrics, shares appear moderately attractive. On earnings and enterprise multiples, pricing is less compelling relative to history. The investment case therefore depends on sustained earnings growth narrowing those multiple gaps.
Risk Assessment & Capital Structure Considerations
CAPREIT’s risk profile blends leverage exposure with moderate operating stability. The Altman Z-score of 1.05 places the trust in the distress zone, signaling elevated financial risk under traditional credit analysis frameworks. Although residential rental portfolios tend to generate stable cash flows, high leverage magnifies cyclical vulnerability.
Debt-to-EBITDA of 14.9x underscores the scale of leverage. Combined with ROIC below WACC, this structure suggests that incremental borrowing has not consistently generated excess returns. While WACC has declined to 5.7%, narrowing the gap with ROIC, the spread remains negative.
The Beneish M-Score of negative 2.65 indicates a low probability of earnings manipulation, offering some reassurance regarding accounting integrity. However, revenue per share has declined over the past year, highlighting the need for renewed top-line momentum.
Ownership dynamics present additional considerations. Insider ownership stands at 0.0%, and institutional ownership is also reported at 0.0%. The absence of insider and institutional positions may reflect structural listing characteristics rather than sentiment, but it reduces alignment signals often valued by long-term investors.
Liquidity is constrained. Daily trading volume recently fell to 504 shares compared with a two-month average of 11,727 shares. Such thin activity can amplify price swings and complicate large trade execution. A Dark Pool Index of 60% suggests that a majority of trades occur off-exchange, potentially limiting visible price discovery.
Government contract revenue has fluctuated, rising to $1,000,000 in 2021 before declining to $400,000 in 2022 and stabilizing in 2023. While not central to the investment thesis, variability in ancillary income streams reinforces the importance of core rental operations.
Overall, financial leverage and capital efficiency remain the principal risk vectors. Improvements in earnings and cost of capital trends must translate into sustained positive economic spreads to justify current valuation levels.
Final Assessment
Canadian Apartment Properties REIT offers a combination of moderate intrinsic undervaluation and a competitive 4.1% dividend yield. Revenue growth of 4–5% aligns with industry expectations, and recent quarterly earnings demonstrate encouraging momentum.
Dividend coverage at 80.0% of earnings appears manageable, particularly given projected EPS of $1.895 and $1.975 over the next two fiscal years. Forward dividend growth near 5% suggests gradual income expansion rather than aggressive increases.
Yet the core challenge lies in capital efficiency. With ROIC at 3.4% against a WACC of 5.7%, the trust continues to earn below its cost of capital. Debt-to-EBITDA of 14.9x compounds this issue, limiting financial flexibility and increasing refinancing sensitivity.
Valuation offers some support. Trading 13.4% below intrinsic value and at 0.7x book, shares provide a degree of downside buffer. However, elevated EV/EBITDA and P/E multiples relative to long-term medians temper enthusiasm.
For income-oriented investors comfortable with moderate leverage and seeking stable residential exposure, CAPREIT presents a balanced, though not risk-free, opportunity. Sustainable value creation will depend less on incremental rent growth and more on disciplined capital allocation that closes the gap between returns and cost of capital.