
BSR Real Estate Investment Trust: Yield Without Coverage
A Sunbelt Multifamily REIT Trading Above Intrinsic Value Amid Leverage Strain

Investment Thesis
A Sunbelt-Focused Multifamily REIT Facing Structural Profitability and Valuation Pressures
BSR Real Estate Investment Trust operates as an open-ended REIT focused on acquiring and operating garden-style multifamily communities across high-growth Sunbelt markets, primarily in Arkansas, Texas, and Oklahoma. Rental income remains its core revenue driver, positioning the trust within a residential real estate segment that typically benefits from demographic tailwinds and migration trends.
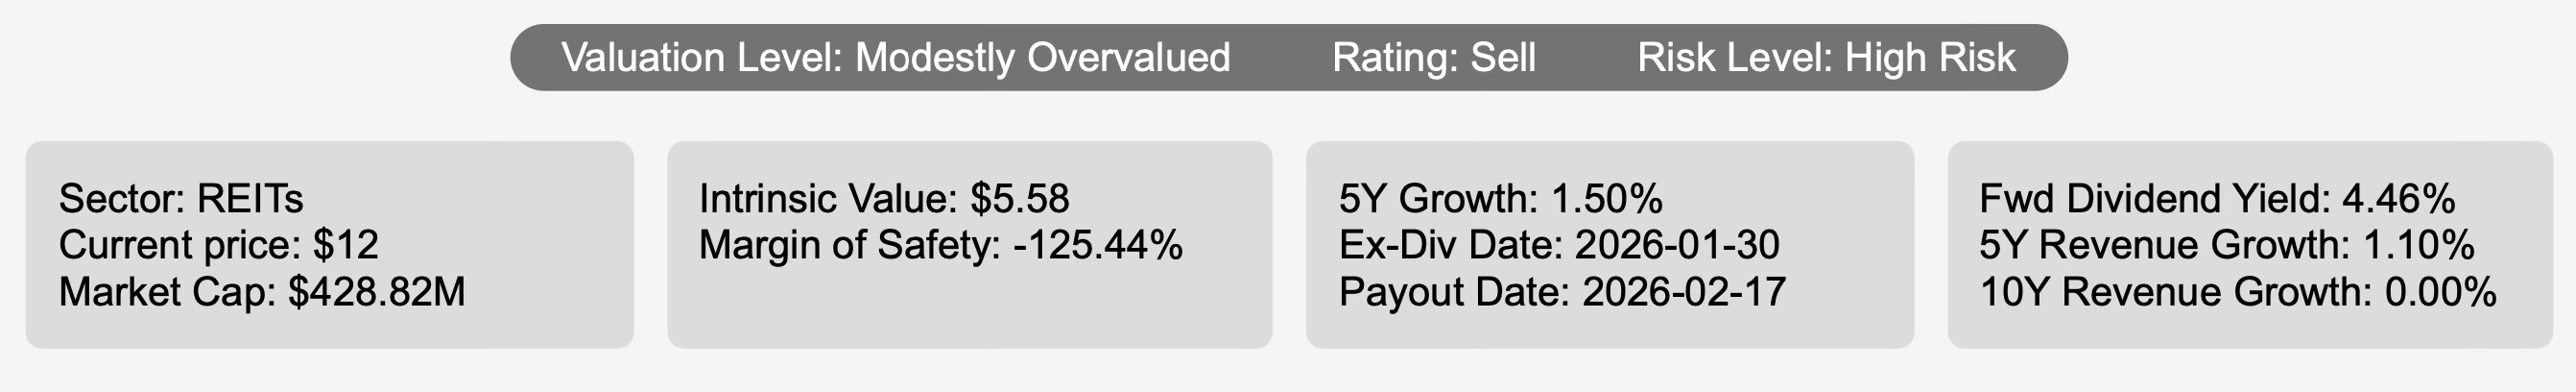
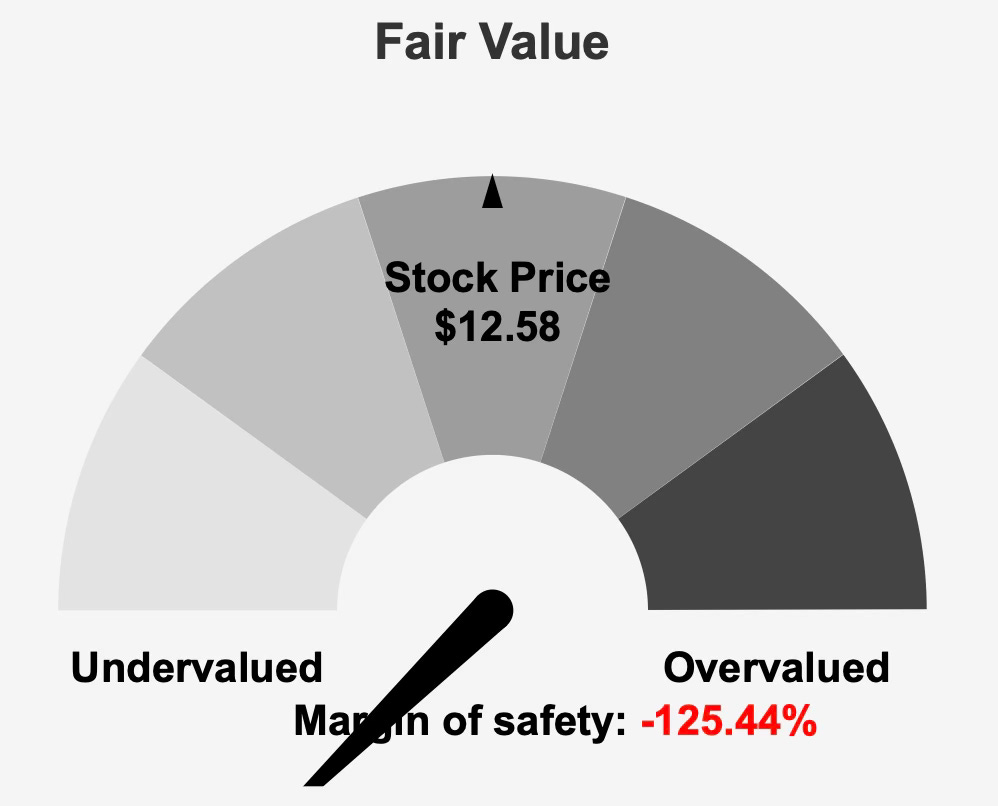
Despite that favorable geographic exposure, the current investment case is constrained by a widening gap between market pricing and underlying economic performance. Shares trade at $12 against an estimated intrinsic value of $5.58, implying a negative margin of safety of 125.4%. With a market capitalization of $428.8 million, the equity appears priced for improvement that has yet to be demonstrated in sustained financial metrics.
Over the past five years, revenue has grown at an annualized rate of just 1.1%, while the 10-year revenue growth rate stands at 0.0%. Earnings momentum has been inconsistent, and returns on invested capital remain structurally below the cost of capital. Although recent quarterly figures show improvement from prior losses, longer-term performance has not yet confirmed a durable turnaround.
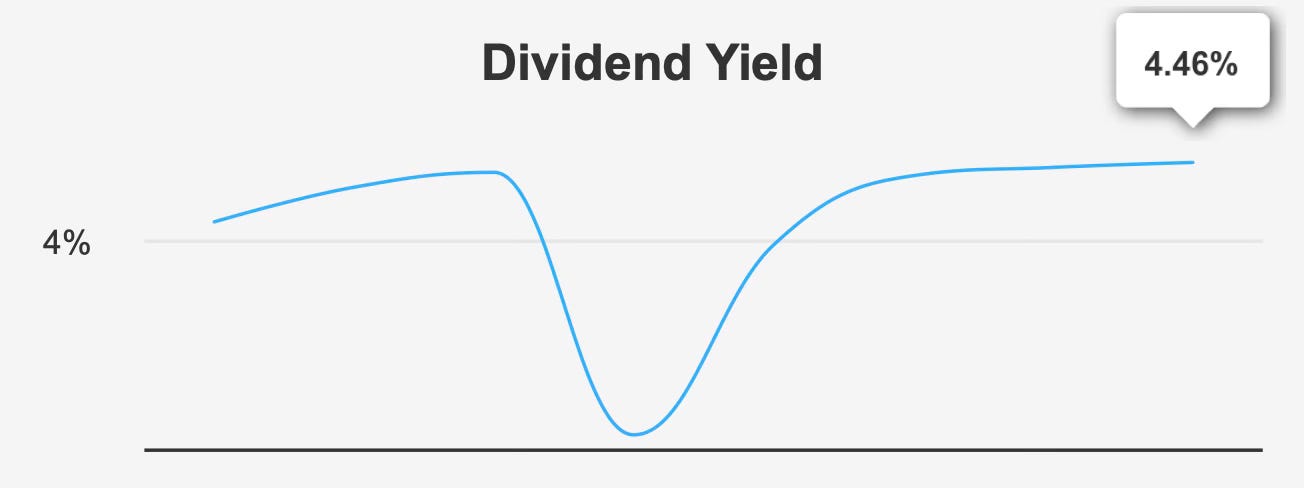
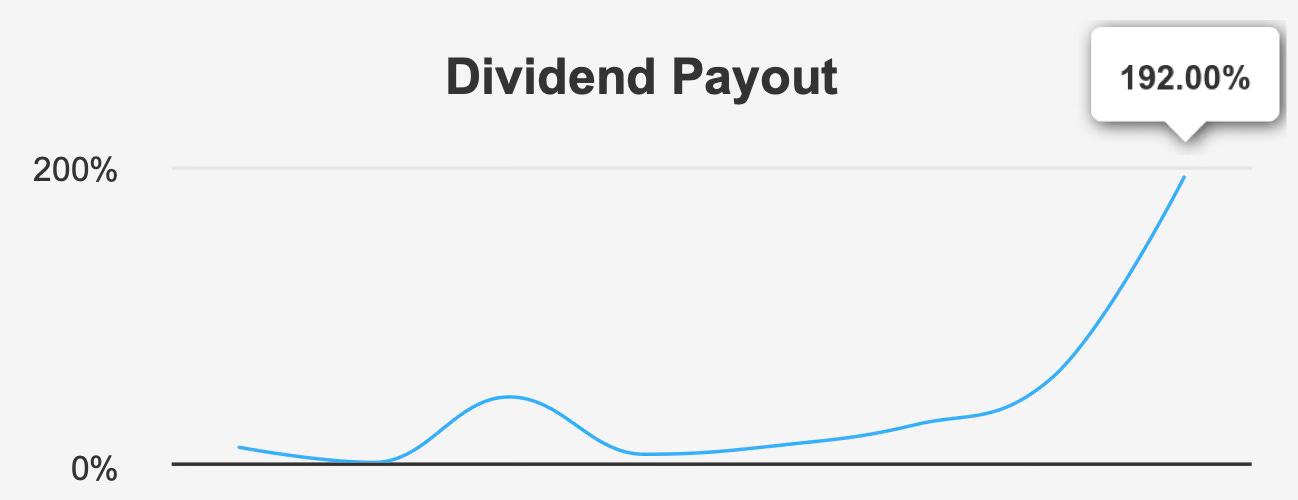
The forward dividend yield of 4.5% may attract income-focused investors, but the underlying payout ratio of 192% raises significant sustainability concerns. At present valuation levels, investors are paying a premium multiple for a REIT that has not consistently generated economic value.
The thesis therefore hinges less on near-term recovery potential and more on structural financial discipline. Without meaningful improvement in earnings coverage and capital efficiency, the current price embeds optimistic assumptions relative to fundamentals.
Earnings Momentum & Profitability Trends
The third quarter ended September 30, 2025 marked a notable operational rebound. EPS excluding non-recurring items improved to $0.426, reversing a loss of $0.164 in the prior quarter and a substantially deeper loss of $0.925 in the same period of 2024. Diluted EPS also turned positive at $0.086, compared with a loss of $0.671 in Q2 2025.
While this sequential improvement is encouraging, revenue per share declined modestly to $0.988 from $1.006 in the previous quarter and fell more sharply from $1.266 a year earlier. This signals that earnings stabilization is occurring alongside softer top-line metrics rather than accelerating revenue growth.
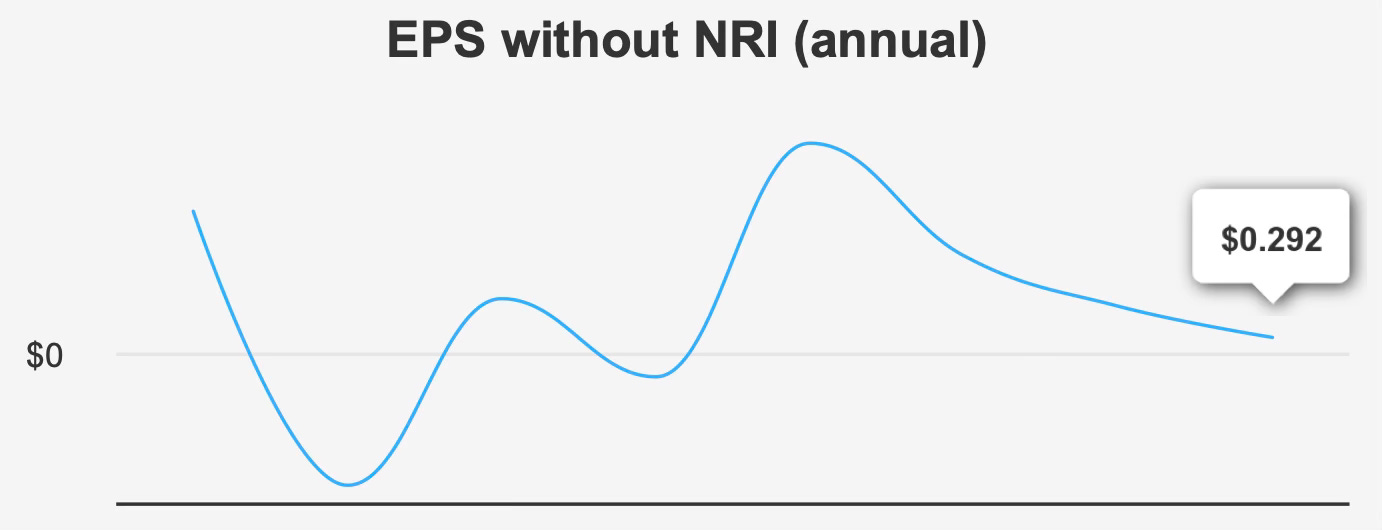
Longer-term earnings trends remain subdued. Both the five-year and ten-year compound annual growth rates for EPS excluding non-recurring items are 0.0%, underscoring limited structural expansion over time. Analysts project EPS of negative 1.100 for the next fiscal year-end, followed by a rebound to positive 0.850 the subsequent year. That swing suggests volatility rather than steady compounding.
Revenue estimates for 2025 through 2027 imply modest growth from $145.7 million to $151 million, a trajectory consistent with the historical 1–2% annual pace. The broader industry is forecast to expand at roughly 5% annually over the next decade, meaning BSR may continue to lag sector growth unless operating leverage improves.
Profitability metrics reinforce this concern. The most recent gross margin of 51.1% sits at the low end of the company’s 10-year range and below the five-year median of 54.3%. While not alarming in isolation, this margin compression reflects limited buffer against rising costs or occupancy fluctuations.
Capital allocation trends have also diluted per-share performance. Over the past year, the buyback ratio was negative 0.3%, indicating a net increase in shares outstanding. Over five years, the ratio stands at negative 9.4%, confirming consistent share count expansion. In a REIT structure where external capital issuance is common, this dynamic can suppress per-share growth unless asset-level returns exceed dilution.
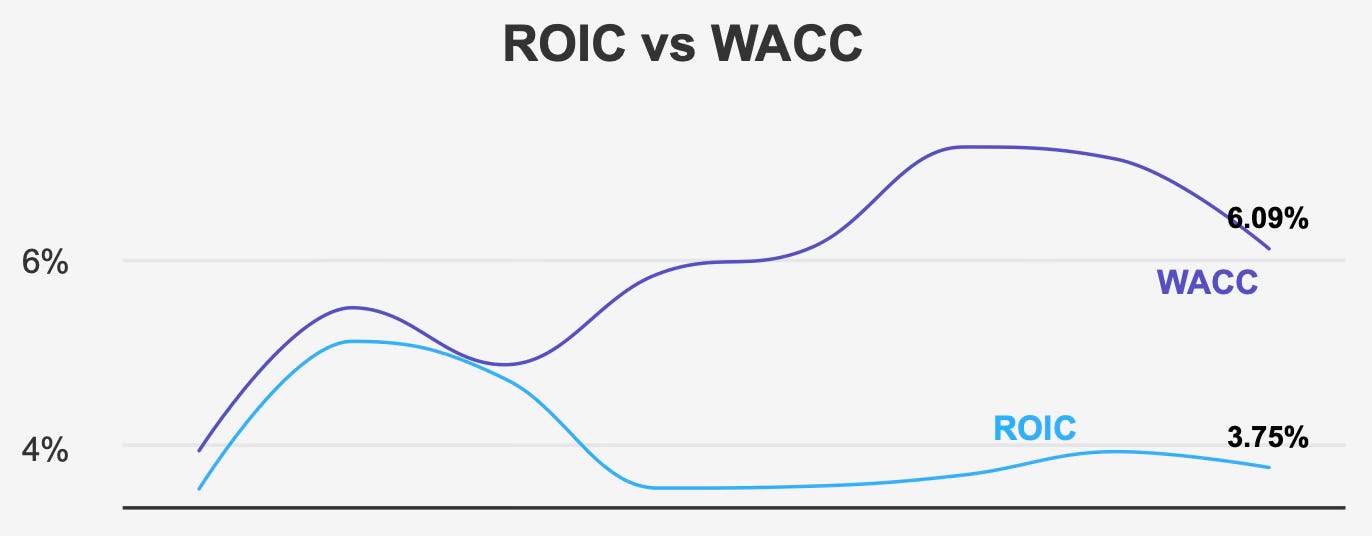
The more structural issue lies in capital efficiency. Recent return on invested capital is 3.8%, compared with a weighted average cost of capital of 6.1%. Over the past five years, median ROIC of 3.7% has remained consistently below median WACC of 6.1%. This spread indicates persistent economic value destruction rather than creation.
Return on equity currently stands at negative 3.4%, reflecting ongoing profitability strain. Over the past decade, ROE has ranged from negative 25.0% to positive 57.5%, highlighting pronounced volatility rather than stable compounding. Until ROIC rises above WACC on a sustained basis, earnings growth alone will not translate into shareholder value creation.
Dividend Profile & Sustainability
BSR’s dividend yield of 4.5% sits modestly above its 10-year median yield of 4.3%, suggesting the current payout is broadly in line with historical norms from a yield perspective. The appeal, however, is undercut by coverage dynamics.
The dividend payout ratio stands at 192%, far above the historical range of approximately 100–102%. A payout ratio at this level implies distributions materially exceed earnings capacity. Dividend coverage is negative 1.09, reinforcing the mismatch between cash generation and distributions.
Dividend growth has been restrained. Over the past five years, the annual growth rate is 1.5%, with a slightly higher 2.4% rate over three years. Forward dividend growth is estimated at 2.3%, broadly consistent with historical patterns but unlikely to accelerate meaningfully unless earnings normalize.
The next ex-dividend date is January 30, 2026, with payment scheduled for February 17, 2026. While the REIT has maintained its payout, the sustainability question centers on leverage and earnings stability rather than yield level.
Debt-to-EBITDA stands at 40.5x, an exceptionally elevated figure that signals significant leverage risk. For a REIT, leverage is intrinsic to the business model, yet this magnitude places strain on flexibility and refinancing capacity. Interest coverage is 1.8x, well below conservative thresholds, indicating limited cushion against rising borrowing costs or operational disruption.
Given these metrics, dividend sustainability appears contingent on earnings recovery rather than surplus cash flow. Without improved profitability and deleveraging, future dividend growth may remain constrained or require balance sheet trade-offs.
Valuation
Market Pricing Reflects Optimism Despite Weak Economic Returns and Elevated Multiples
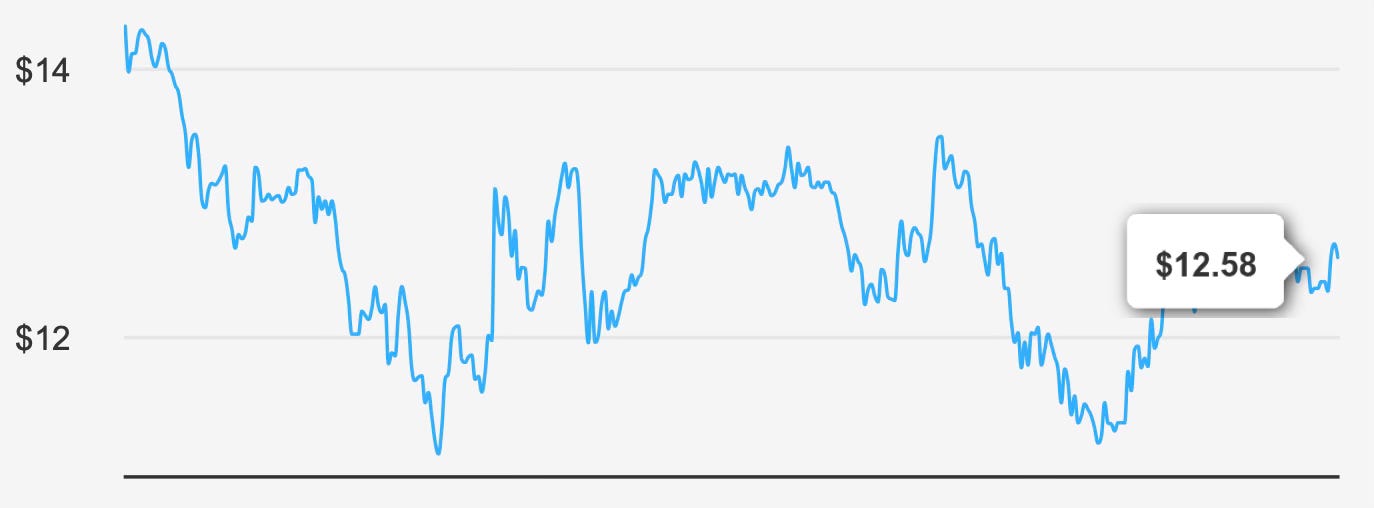
At a current price of $12.58 relative to intrinsic value of $5.58, shares trade at more than double estimated fair value, resulting in a negative margin of safety of 125.4%. This gap suggests the market is discounting a recovery trajectory not yet visible in long-term returns.
The forward P/E ratio stands at 16.8x. While forward multiples can normalize as earnings recover, the trailing twelve-month period reflects losses, limiting comparability. Over the past decade, the median P/E ratio has been 3.2x, underscoring how elevated the current multiple appears relative to historical norms.
On an enterprise basis, the valuation appears even more stretched. The TTM EV/EBITDA ratio is 63.5x, compared with a 10-year median of 5.0x. Although historical extremes ranged widely, the present multiple suggests earnings compression or capital structure distortion that significantly inflates enterprise value relative to EBITDA.
The price-to-book ratio of 0.7x is closer to historical norms, slightly above the 10-year median of 0.7x. This metric may appear reasonable for a REIT with tangible real estate assets. However, book value alignment does not offset weak returns on capital or the negative margin of safety implied by intrinsic valuation.
Analyst coverage remains limited, with only one rating and a price target that has drifted down from $15. Sentiment appears cautious rather than supportive of expansion multiples.
Overall, valuation metrics reflect optimism relative to both intrinsic value and historical trading ranges. Without a sustained improvement in ROIC, EBITDA stability, and earnings coverage, multiple compression remains a credible risk.
Risk Assessment & Capital Structure Considerations
Several financial indicators point to elevated risk. The Altman Z-score of 0.08 places the trust firmly within the distress zone, signaling heightened bankruptcy risk under traditional credit metrics. The Beneish M-Score of negative 0.82 raises accounting quality concerns, although not definitively conclusive.
Interest coverage of 1.8x underscores vulnerability in meeting debt obligations, particularly if rental growth slows or financing costs rise. The substantial Debt-to-EBITDA ratio compounds refinancing risk.
Return metrics reinforce capital inefficiency. With ROIC at 3.8% against WACC of 6.1%, capital deployment has not generated excess returns. Persistent underperformance relative to cost of capital erodes long-term equity value.
Revenue per share has declined year over year, and share issuance trends have diluted ownership. Institutional ownership stands at 18.7%, while insider ownership is 0.0%, suggesting limited alignment between management and shareholders through direct equity stakes.
Liquidity appears moderate, with average daily trading volume around 20,734 shares over the past two months. Recent daily volume of 11,355 shares represents roughly 54.8% of that average, indicating somewhat lighter trading activity. A Dark Pool Index of 35% implies notable off-exchange activity, which may reduce visible liquidity.
While operating margin expansion and yield levels near five-year highs provide modest positives, they do not outweigh leverage, valuation, and coverage concerns.
Final Assessment
BSR Real Estate Investment Trust offers exposure to Sunbelt multifamily markets and a dividend yield of approximately 4.5%. However, the broader financial profile tempers that appeal.
Earnings have recently improved on a quarterly basis, yet long-term growth remains minimal, with five- and ten-year EPS growth rates at 0.0%. Revenue growth has averaged roughly 1–2%, trailing industry expectations. More critically, returns on invested capital remain below the cost of capital, signaling structural value erosion.
The dividend payout ratio of 192% and Debt-to-EBITDA of 40.5x introduce material sustainability risk. While the payout has been maintained, coverage metrics suggest limited flexibility absent meaningful earnings recovery.
Valuation presents the most pronounced challenge. Trading at $12.58 against intrinsic value of $5.58 and at elevated multiples relative to historical norms, the stock embeds a recovery scenario that is not yet fully supported by capital efficiency or balance sheet strength.
For income-oriented investors prioritizing yield stability with conservative leverage and durable coverage, the current profile appears aggressive. Until ROIC consistently exceeds WACC and leverage moderates, risk-adjusted returns remain skewed to the downside.
At present levels, the stock appears priced ahead of fundamentals rather than supported by them.