
Brown & Brown, Inc.: Dividend Growth Strength Confronts Capital Allocation Strain
Strong historical earnings expansion and low payout ratios are overshadowed by valuation risk and economic value erosion

Investment Thesis: Durable Earnings Growth Confronts Valuation Risk and Capital Efficiency Challenges
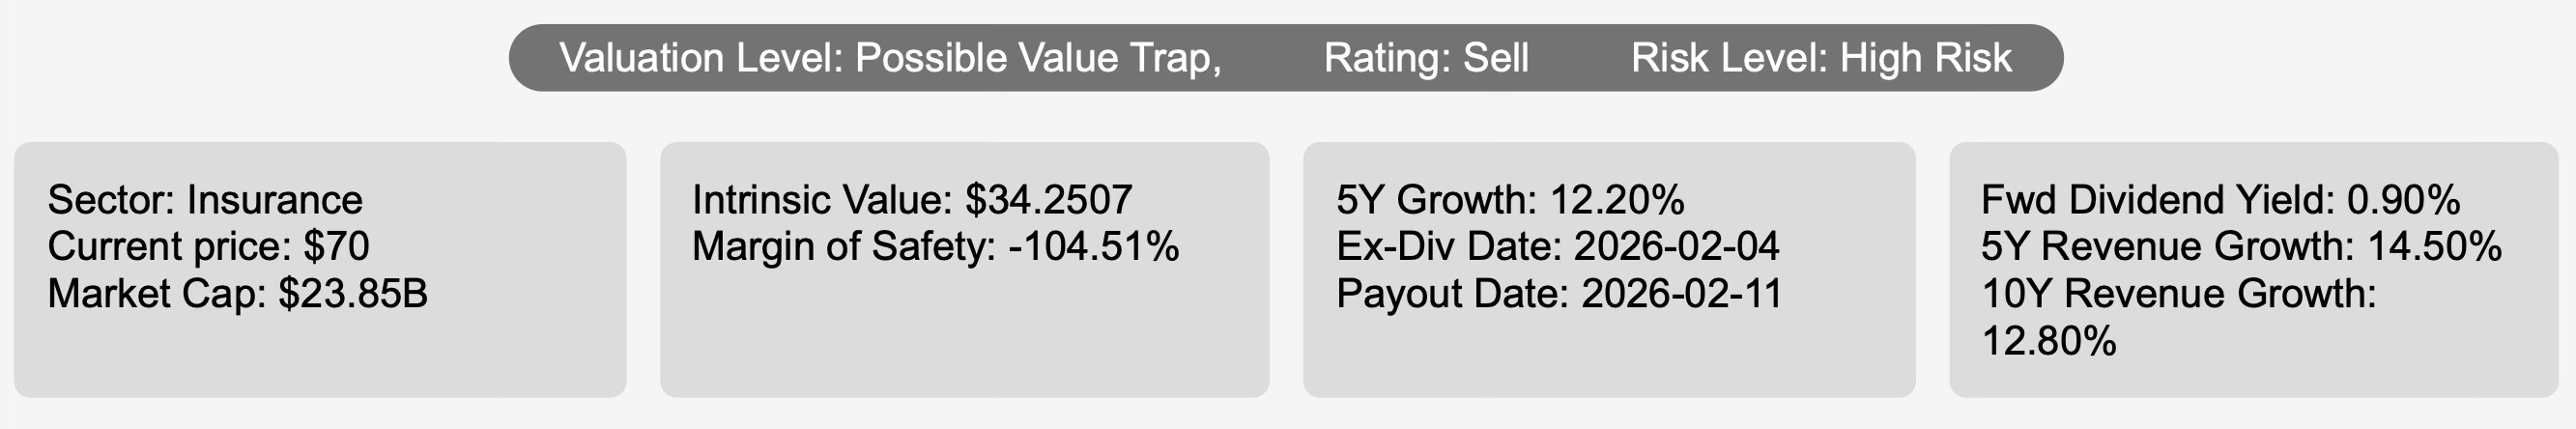
Brown & Brown, Inc. BRO 0.00%↑ operates as a diversified insurance agency and wholesale brokerage platform across the United States, the United Kingdom, and other markets, structured around Retail and Specialty Distribution segments. The business model has historically delivered consistent top-line expansion and strong earnings compounding, reinforced by disciplined cost control and active capital returns.
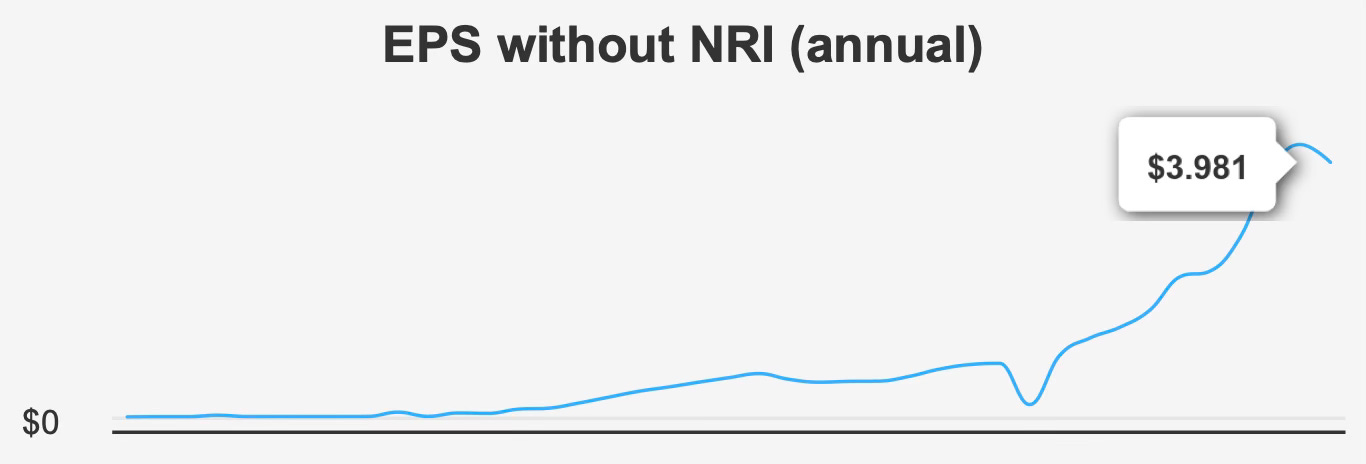
Over the past five years, revenue has expanded at a 14.5% compound rate, with 10-year revenue growth averaging 12.8%. Earnings growth has been even more impressive. EPS without non-recurring items has compounded at 20.7% annually over five years and 25.6% over ten years, demonstrating substantial operating leverage and acquisition-driven scaling.
In the most recent quarter ended December 31, 2025, adjusted EPS of $0.93 declined 12% sequentially from $1.05 but increased 8% year over year from $0.86. On a diluted basis, EPS came in at $0.59, down from $0.68 in the prior quarter and $0.73 a year earlier. Revenue per share of $4.647 was slightly below the prior quarter’s $4.669 but up from $4.042 year over year, reflecting continued top-line growth despite some short-term earnings volatility.
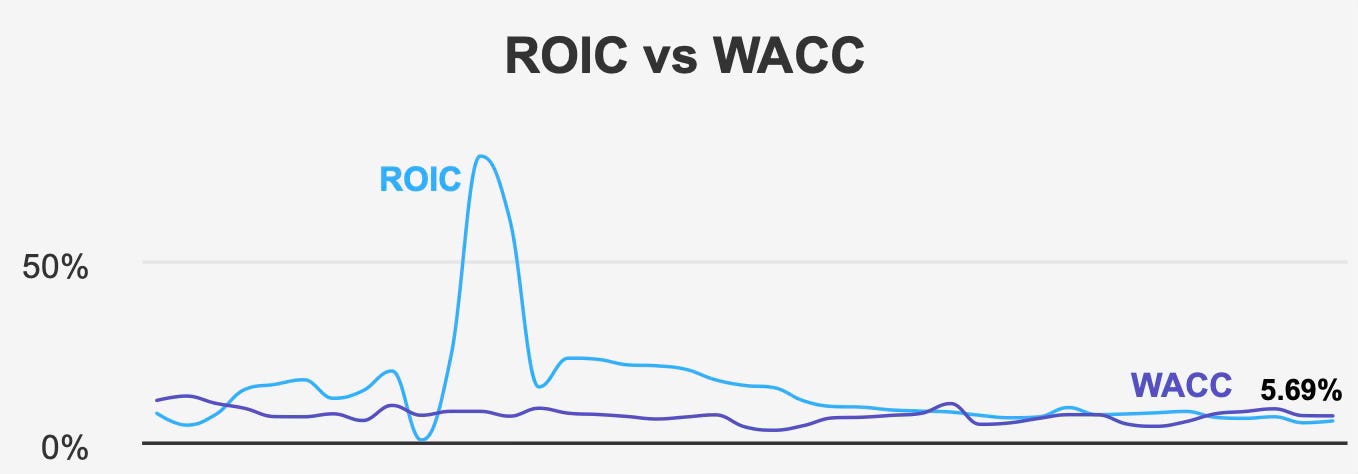
Profitability metrics remain structurally solid. Gross margin reached a 10-year high of 49.1%, exceeding both the five-year median of 48.9% and the 10-year median of 47.2%. Operational efficiency has clearly improved over time. However, capital allocation metrics present a more nuanced picture. The five-year median ROIC of 6.7% trails the 7.7% five-year median WACC. Currently, ROIC stands at 5.7% versus a 7.1% WACC, indicating ongoing economic value erosion. While ROE of 15.3% appears strong, the spread between ROIC and WACC raises questions about incremental capital efficiency.
The company has also been highly active in repurchasing shares, retiring 17.5% of shares outstanding over the past year. The five-year buyback ratio of negative 2.6% confirms consistent capital return activity. While buybacks support EPS growth mechanically, they do not fully offset the broader issue of capital earning below cost.
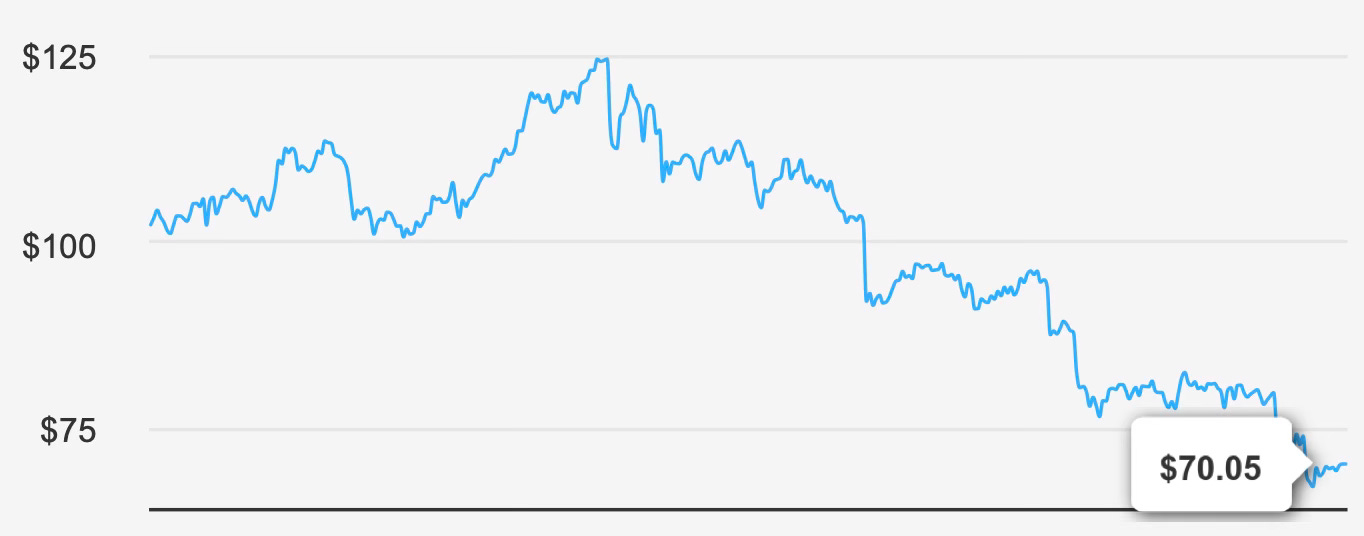
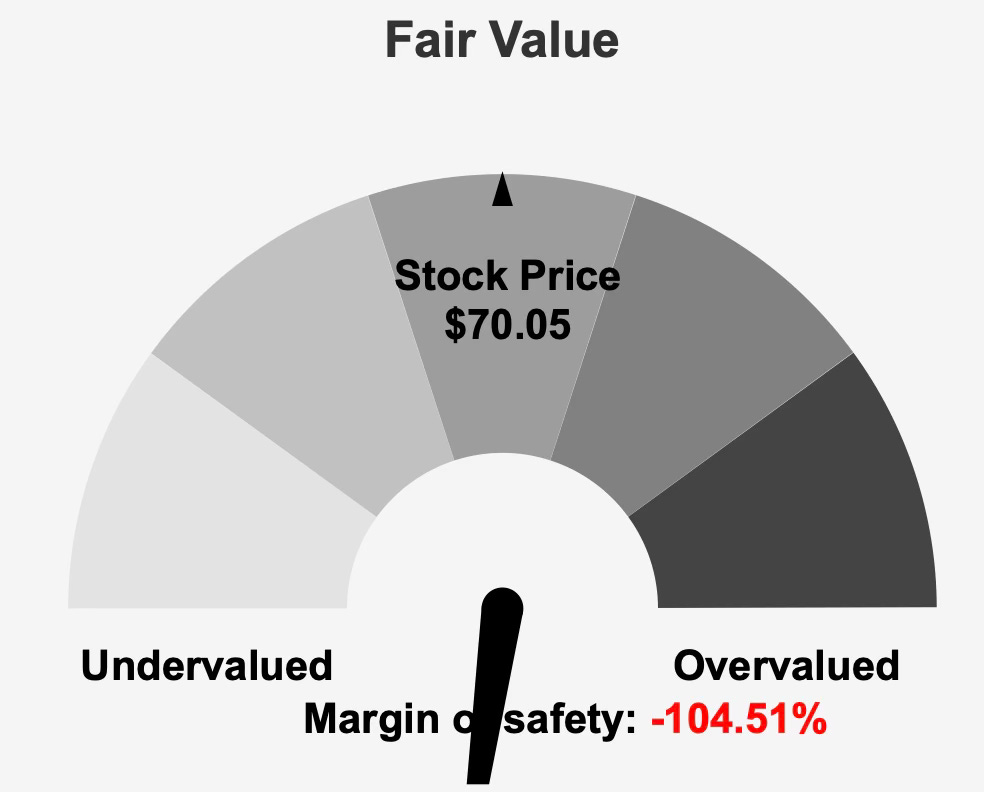
At $70 per share and a market capitalization of $23.85 billion, the stock trades at more than double its calculated intrinsic value of $34.25, resulting in a negative margin of safety exceeding 100%. This gap frames the central tension: operational quality versus valuation discipline.
Earnings Momentum & Profitability Trends: Long-Term Compounding with Emerging Capital Discipline Questions
Brown & Brown’s earnings trajectory over the past decade has been one of consistent acceleration. The 20.7% five-year EPS CAGR and 25.6% 10-year CAGR underscore an organization capable of compounding earnings at rates well above industry averages. Industry forecasts suggest approximately 3.5% annual growth over the next decade, implying that company-specific execution has historically driven outperformance.
Analysts expect revenue to reach $7,184.39 million in 2026 and grow further to $8,005.67 million by 2028. Estimated EPS for fiscal 2026 stands at $3.489, rising to $3.939 the following year. These projections suggest continued expansion, albeit at a more measured pace relative to historical growth.
Margin performance supports the earnings narrative. The recent 49.1% gross margin reflects sustained pricing power and operating leverage. Operating margins have expanded as well, reinforcing the company’s ability to convert revenue growth into profit.
Yet beneath the surface, capital efficiency remains mixed. Historically, ROIC has ranged between 5.2% and 9.4%, while WACC has fluctuated between 4.2% and 9.0%. This variability has produced alternating periods of value creation and destruction. The current configuration—ROIC at 5.7% versus WACC at 7.1%—leans toward value erosion.
Asset growth of 26.7% has materially outpaced revenue growth of 14.5%, suggesting that incremental capital deployed has not translated proportionately into incremental revenue. This imbalance can dilute long-term return metrics unless operating leverage improves meaningfully.
Overall, earnings momentum remains intact, but the sustainability of high historical compounding rates will depend on improved capital productivity rather than financial engineering alone.
Dividend Profile & Sustainability: Conservative Payout Provides Structural Flexibility
Brown & Brown’s dividend profile is characterized by rapid historical growth and conservative payout discipline. The five-year dividend growth rate of 12.2% and three-year growth rate of 13.3% reflect a management team committed to consistent capital returns. The most recent quarterly dividend increase—from $0.15 to $0.165—signals a moderation in pace but not in direction.
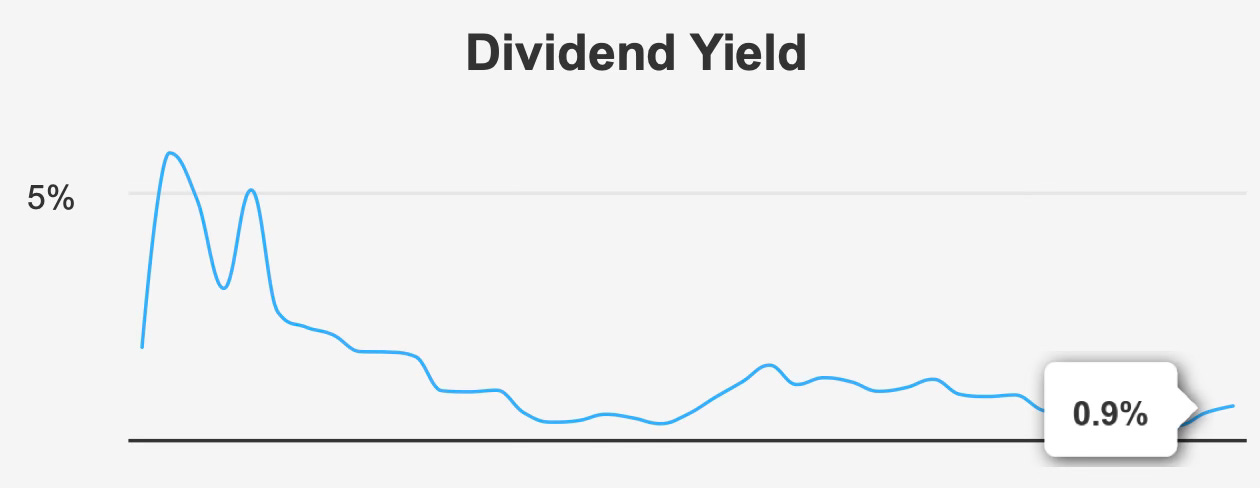
The forward dividend yield of 0.9% sits modestly above the 10-year median of 0.75% and well above the historical low of 0.44%. While the yield remains below broader sector averages, its attractiveness lies less in current income and more in sustainability.
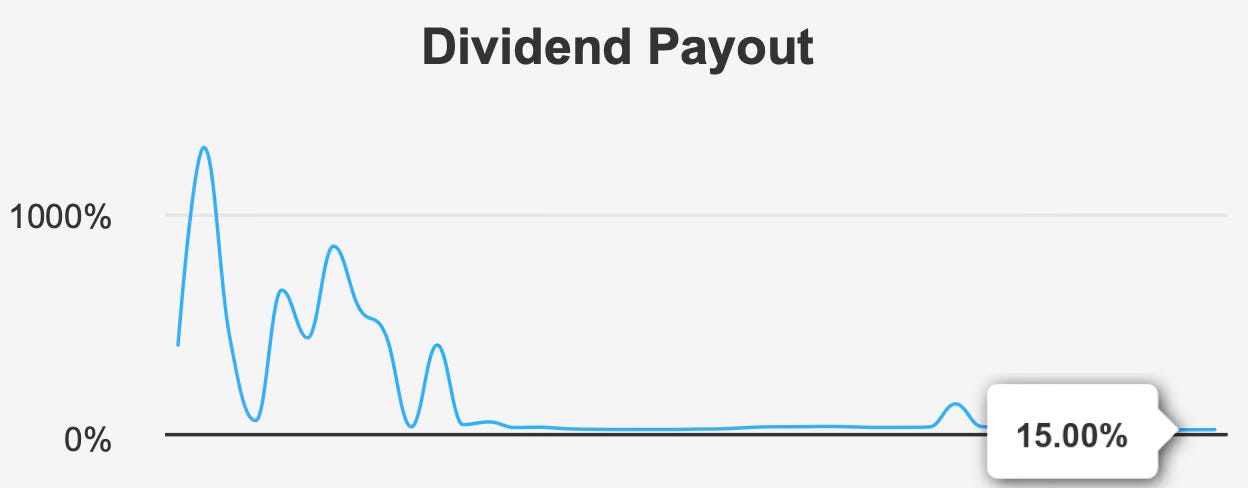
The dividend payout ratio stands at just 15.0%, a dramatic improvement from the 10-year high of 101.3%. Dividend coverage of 5.2x provides substantial room for continued increases even if earnings growth moderates. Forecasted dividend growth of 7.45% suggests a transition toward mid-single-digit expansion, consistent with maturing scale.
Balance sheet leverage is a key variable in dividend assessment. Debt-to-EBITDA of 3.87x approaches, but does not exceed, the 4.0x threshold often associated with elevated caution. The company has increased long-term debt by $3.7 billion over the past three years, introducing incremental financial risk. However, current coverage metrics indicate that dividend obligations remain comfortably supported.
The next ex-dividend date occurred on February 4, 2026, with payment on February 11, 2026. Assuming quarterly continuity, the next ex-dividend date is expected around early May 2026.
In summary, the dividend appears secure, conservatively structured, and capable of moderate growth, though its low yield limits immediate income appeal.
Valuation Analysis: Premium Market Pricing Relative to Intrinsic Value Limits Margin of Safety
At $70.05 per share, Brown & Brown trades substantially above its calculated intrinsic value of $34.25, implying a negative margin of safety of roughly 104.5%. This discrepancy frames valuation risk clearly: even if operational performance remains solid, the current price embeds high expectations.
On an earnings basis, the trailing P/E ratio of 21.9x sits below the 10-year median of 26.4x, suggesting a relative discount to historical norms. The forward P/E of 15.5x appears more moderate, reflecting anticipated earnings growth. The EV/EBITDA multiple of 15.0x is also below its 10-year median of 16.6x.
Revenue and book value multiples paint a similar picture. The price-to-sales ratio of 3.8x remains below the 10-year median of 4.69x. The price-to-book ratio of 1.88x sits near its 10-year low of 1.83x. Price-to-free-cash-flow of 16.1x is also below historical median levels.
Viewed in isolation, these multiples do not appear extreme. However, valuation must be assessed relative to intrinsic value and capital efficiency. The intrinsic valuation framework indicates significant overpricing, even if multiples appear compressed versus historical averages.
Analyst price targets average $84.63, unchanged over the past week but revised downward in recent months. The directional adjustment suggests moderating sentiment despite continued institutional ownership of 77.45%.
The central valuation tension lies in this divergence: historically reasonable trading multiples versus a fundamentally high price relative to estimated fair value.
Risk Assessment & Capital Structure Considerations: Leverage and Economic Value Erosion Elevate Risk Profile
Brown & Brown carries a mixed risk profile, with operational stability counterbalanced by balance sheet and capital allocation concerns.
The $3.7 billion increase in long-term debt over three years has raised leverage metrics. Debt-to-EBITDA of 3.87x remains within manageable limits but reduces financial flexibility. An Altman Z-score of 1.54 places the company within the distress zone, implying heightened bankruptcy risk within two years under adverse conditions.
The Sloan ratio of negative 25.07% introduces questions around earnings quality, though the Beneish M-Score indicates a low likelihood of manipulation. This distinction suggests that while accrual dynamics warrant monitoring, there is no overt evidence of accounting irregularities.
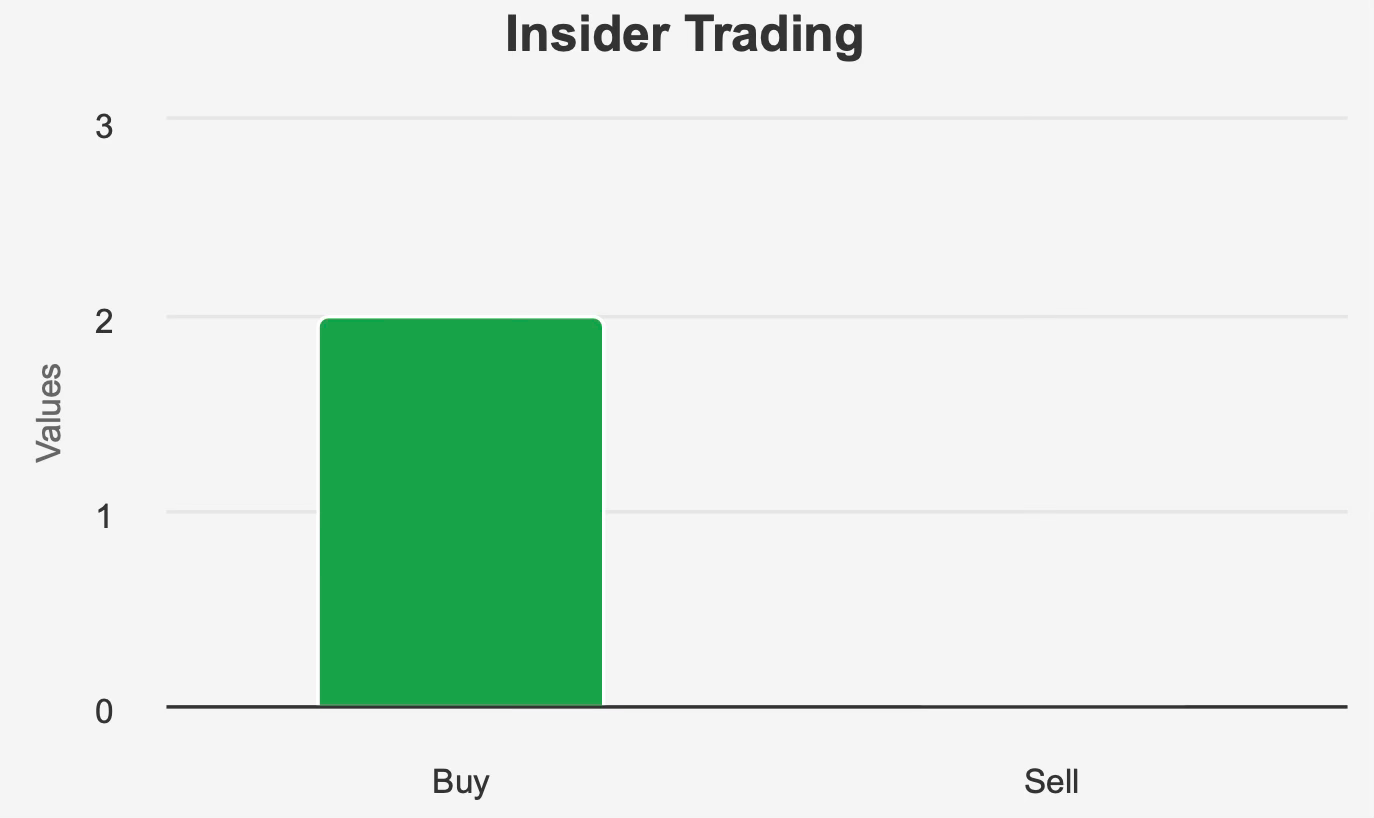
Institutional ownership of 77.45% reflects strong professional investor participation, while insider ownership remains modest at 1.12%. Insider trading activity has been limited, with two purchases and no sales in the past year.
Liquidity appears adequate, with average daily volume of approximately 3.19 million shares. A Dark Pool Index of 29.38% indicates substantial institutional trading activity.
Congressional trading activity in January 2026 resulted in transactions that subsequently underperformed the broader market, reinforcing near-term cautionary sentiment.
In aggregate, leverage expansion, sub-WACC ROIC, and a low Altman Z-score elevate the company’s risk classification to high.
Final Assessment
Brown & Brown represents a high-quality insurance brokerage platform with impressive long-term earnings growth, expanding margins, disciplined dividend policy, and strong institutional sponsorship. The company has demonstrated the ability to compound earnings at attractive rates while maintaining conservative payout ratios.
However, capital allocation efficiency remains inconsistent, with ROIC trailing WACC and asset growth outpacing revenue expansion. Leverage has increased meaningfully, and valuation at $70 per share implies more than double the calculated intrinsic value.
For dividend growth investors, the stock offers security and moderate long-term income expansion potential, supported by a 15% payout ratio and 5.2x coverage. Yet the 0.9% yield limits immediate income appeal.
Given the negative margin of safety exceeding 100%, economic value erosion, and elevated leverage metrics, the risk-reward profile currently skews unfavorably despite operational strength. Long-term fundamentals remain constructive, but valuation discipline suggests patience.
At present levels, the shares appear priced for continued execution without margin for error.