
Bridgemarq Real Estate Services: Value Opportunity or Structural Value Trap?
A High-Yield Real Estate Services Franchise at a Critical Inflection Point

Investment Thesis: A High-Yield Real Estate Franchise Trading at a Deep Discount to Estimated Intrinsic Value
Bridgemarq Real Estate Services Inc operates as a Canada-based real estate services platform providing information, tools, and brand infrastructure to realtors and brokerages across the country. Through established brands such as Royal LePage, Via Capitale, and Johnston and Daniel, the company functions as a service backbone to real estate professionals rather than acting as a direct property owner or developer.
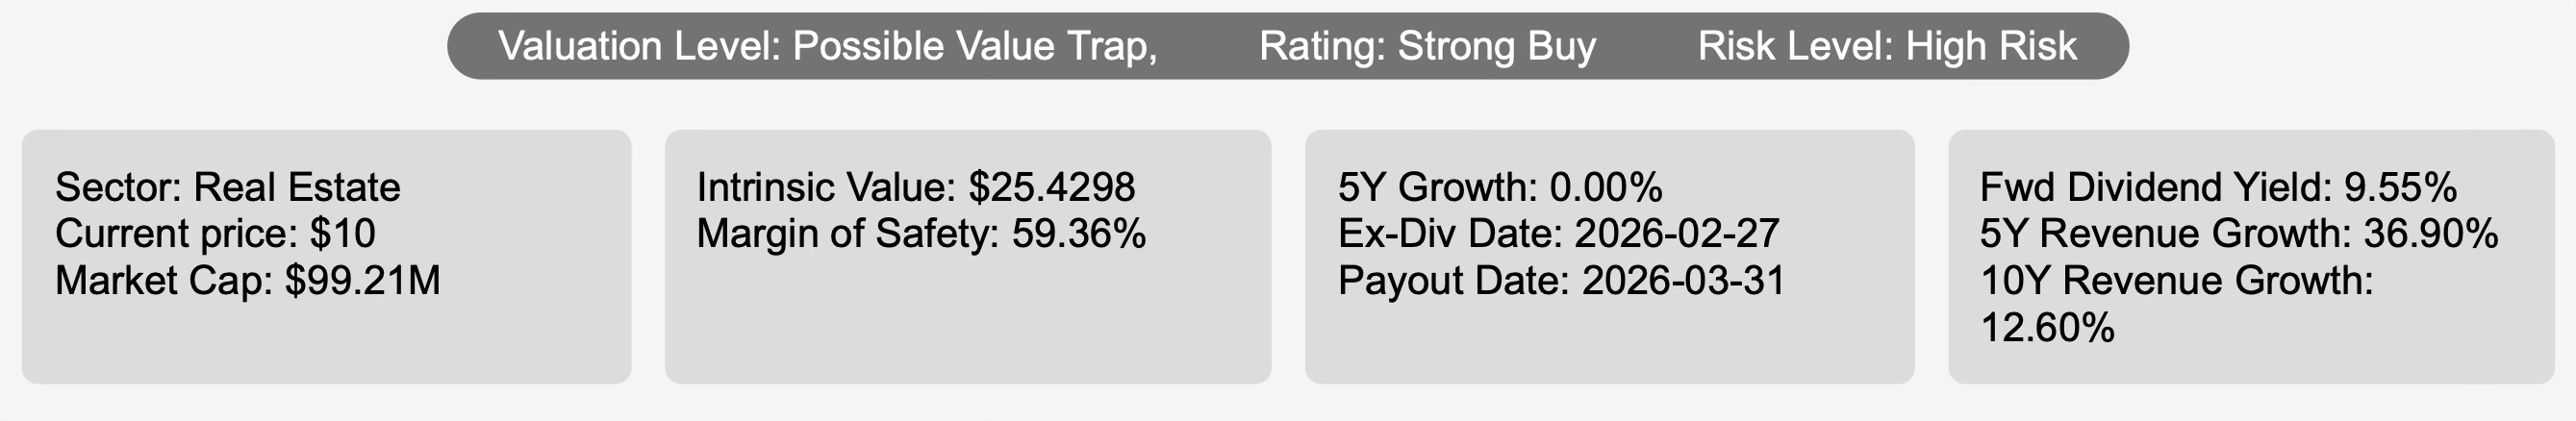
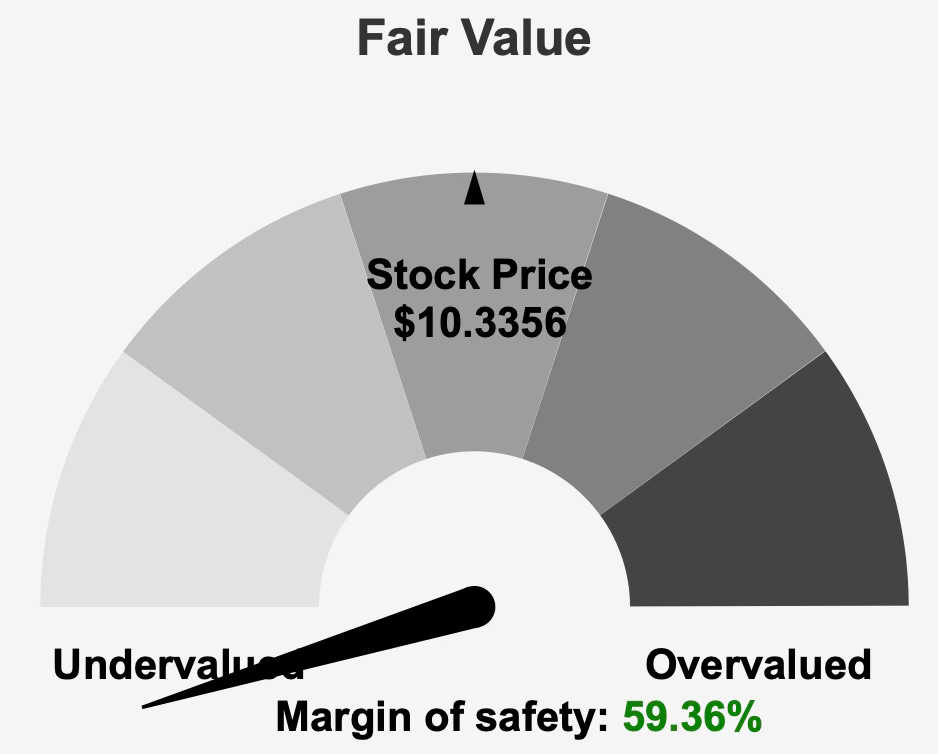
At a current share price of $10 and a market capitalization of approximately $99.2 million, the stock trades materially below its estimated intrinsic value of $25.43. This implies a margin of safety of 59.4%, suggesting significant theoretical upside should fundamentals stabilize and valuation converge toward intrinsic estimates.
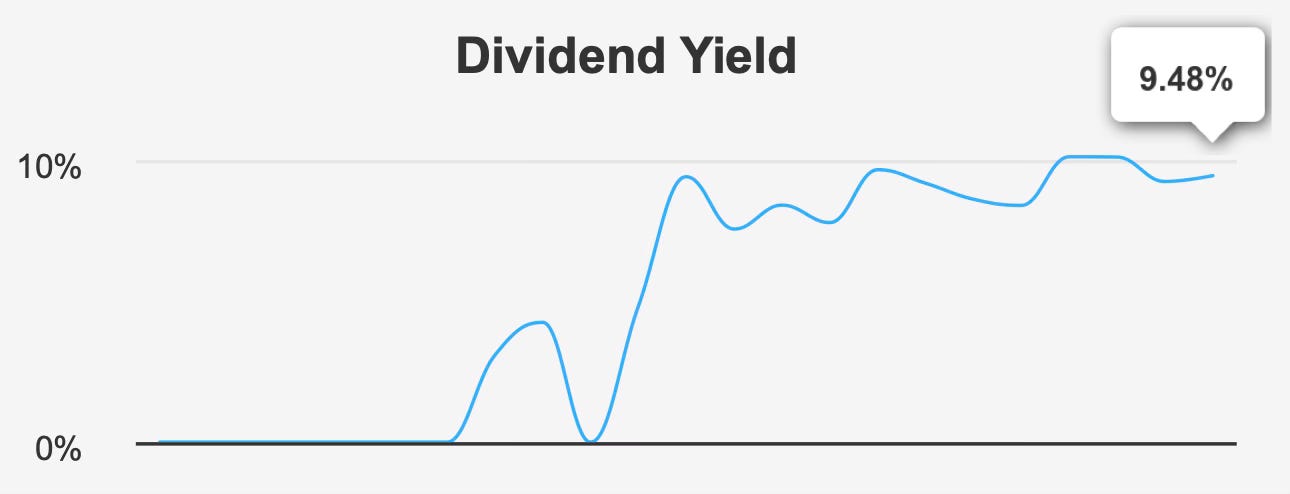
The investment case, however, is not straightforward. The company is currently rated as a possible value trap despite a “Strong Buy” designation, reflecting the tension between apparent undervaluation and deteriorating operational performance. The forward dividend yield stands at 9.6%, placing it among the higher-yielding names within its sector. Yet that income appeal must be weighed against negative earnings, margin compression, and leverage concerns.
Revenue growth over longer horizons has been constructive, with five-year revenue growth of 36.9% and 10-year growth of 12.6%. However, earnings performance has not followed the same trajectory, reflecting structural profitability pressures rather than top-line weakness alone.
The central question for long-term income-oriented investors is whether the current discount compensates sufficiently for execution risk, capital structure strain, and declining returns on capital. Bridgemarq offers a high yield and a statistically wide margin of safety, but it does so amid weakening financial resilience.
Earnings Momentum & Profitability Trends
For the quarter ending September 30, 2025, earnings per share excluding non-recurring items improved sequentially to negative $0.123 from negative $0.22 in the prior quarter. Year over year, however, earnings remained unchanged, indicating that while the near-term trajectory stabilized modestly, structural profitability issues persist.
Revenue per share increased significantly on a quarter-over-quarter basis, rising to $9.367 from $5.023. Compared to the prior year, revenue per share declined slightly from $9.871, suggesting that topline performance has been uneven rather than consistently deteriorating.
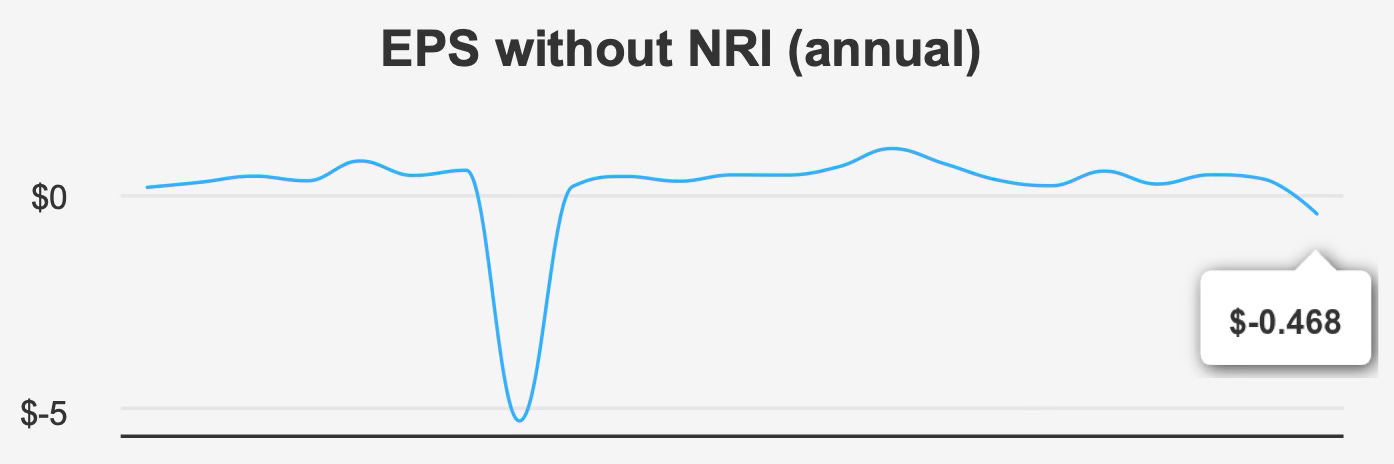
Over a five-year period, EPS excluding non-recurring items has grown at a compound annual rate of 7.9%. However, the 10-year CAGR remains negative at -5.3%, reflecting long-term earnings erosion despite intermittent recoveries. This divergence underscores the cyclical and potentially structural challenges embedded within the company’s business model.
Margin compression is particularly notable. The most recent quarterly gross margin came in at 18.4%, dramatically below the five-year median of 58.3% and the 10-year median of 78.1%. Such a steep deviation from historical norms suggests either materially adverse market conditions or internal operational inefficiencies.
Return on invested capital further illustrates the weakening profitability profile. Over the past five years, the median ROIC stood at 11.6%, comfortably above the corresponding five-year median weighted average cost of capital of 9.5%. Historically, this spread indicated value creation and disciplined capital allocation.
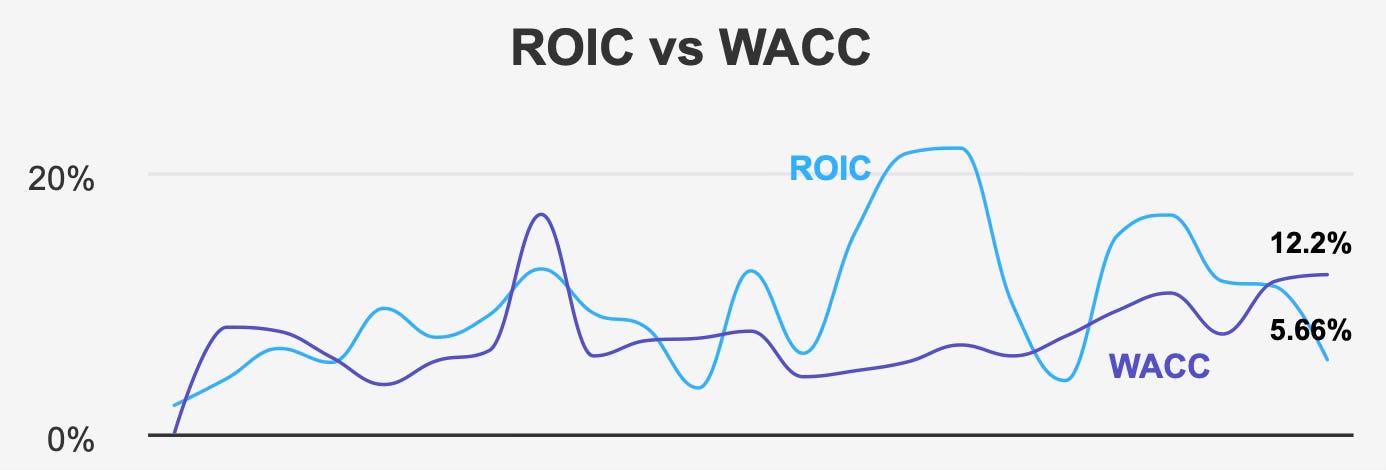
More recently, however, ROIC has declined to 5.7%, falling below the current WACC of 12.2%. This inversion implies that the company is presently destroying economic value, as the cost of capital exceeds returns generated on invested funds. The drop from a 10-year high ROIC of 22.5% to 5.7% marks a significant deterioration in operating efficiency.
Looking ahead, analysts project revenue of $54,317.04 million in 2025, increasing to $60,053.74 million in 2026 and $68,477.24 million in 2027. Despite projected revenue expansion, estimated EPS for the next fiscal year is negative $0.276 before a forecast recovery to $0.203 in the following year. This suggests that operational improvement is expected but not imminent, leaving a transitional period where profitability remains under pressure.
With the next earnings report anticipated around March 13, 2026, the company stands at a critical juncture. Revenue growth alone will not be sufficient; margin restoration and capital efficiency must follow.
Dividend Profile & Sustainability
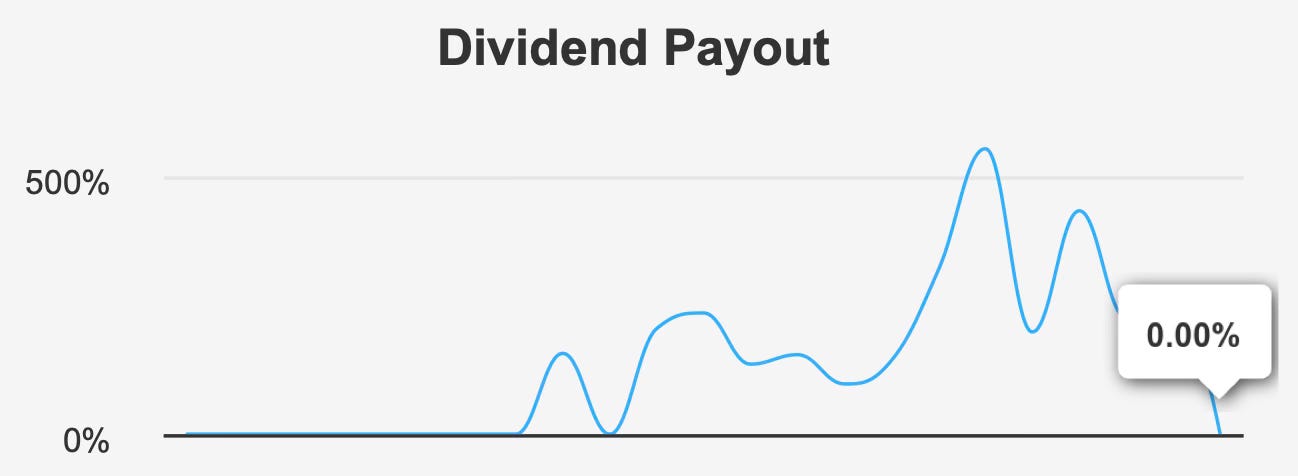
Bridgemarq’s dividend profile is characterized by high yield but zero growth. The five-year and three-year dividend growth rates both stand at 0.0%, indicating that management has opted for stability rather than progressive increases.
The forward dividend yield of 9.5% remains compelling in absolute terms. Historically, the yield has ranged from a high of 20.2% to a low of 6.8%, with a 10-year median of 9.0%. The current yield therefore sits slightly above its long-term midpoint, suggesting that elevated income is partly a function of price weakness rather than dividend expansion.
The next ex-dividend date is February 27, 2026, with a payout scheduled for March 31, 2026. The dividend is distributed monthly, which may appeal to income-focused investors seeking regular cash flow.
However, sustainability metrics warrant caution. The dividend payout ratio is currently 0.0%, reflecting the absence of earnings from which to distribute capital. Dividend coverage stands at -1.16, signaling that current earnings do not support the distribution. In effect, the dividend is being maintained despite negative profitability.
Leverage compounds this vulnerability. The Debt-to-EBITDA ratio stands at 5.04, exceeding the commonly cited 4.0 threshold that often delineates higher financial risk. Elevated leverage reduces flexibility and increases sensitivity to further earnings volatility.
Importantly, no dividend growth is forecast over the next three to five years. Combined with declining margins and sub-WACC returns on capital, this suggests that the dividend may remain static at best and pressured at worst if profitability fails to recover.
The income profile is therefore attractive on the surface but rests on a fragile foundation. Investors must recognize that yield is currently compensating for financial risk rather than signaling underlying strength.
Valuation: Deep Discount to Intrinsic Value Offset by Elevated Earnings and Cash Flow Multiples
At $10.34 per share, Bridgemarq trades well below its intrinsic value estimate of $25.43, implying a margin of safety of 59.3%. On a purely intrinsic valuation basis, the discount appears substantial.
However, market-based multiples tell a more nuanced story. The forward P/E stands at 287.1x, reflecting depressed earnings expectations and anticipated volatility. This multiple is significantly above the 10-year median P/E of 24.1x, indicating that current earnings weakness distorts traditional valuation metrics.
On a sales basis, the trailing twelve-month P/S ratio of 0.4x sits well below the 10-year median of 4.22x and only slightly above its 10-year low. This suggests that the market is assigning a discounted multiple to revenue, possibly due to concerns about margin durability rather than topline stability.
Enterprise value to EBITDA currently stands at 12.0x, compared with a 10-year median of 8.9x. While not extreme, this indicates that the stock is not deeply discounted relative to operating cash flow generation. Meanwhile, the price-to-free-cash-flow multiple of 63.6x is materially above its historical median of 13.0x, highlighting significant pressure on free cash flow.
The apparent contradiction between a wide intrinsic value discount and elevated cash flow multiples reflects earnings cyclicality and balance sheet leverage. The market appears skeptical of near-term recovery, pricing in operational uncertainty despite the statistical valuation gap.
In effect, valuation depends heavily on normalization assumptions. If margins recover and ROIC moves back above WACC, today’s price could prove opportunistic. If not, the discount may persist.
Risk Assessment & Capital Structure Considerations
Risk factors are pronounced and cannot be overlooked. Gross and operating margins have declined at average annual rates of -25.7% and -24.7%, respectively, signaling sustained profitability deterioration.
The company’s Altman Z-score of 0.3 indicates elevated bankruptcy risk within two years. Combined with weak interest coverage and leverage above 5.0x Debt-to-EBITDA, balance sheet resilience appears strained.
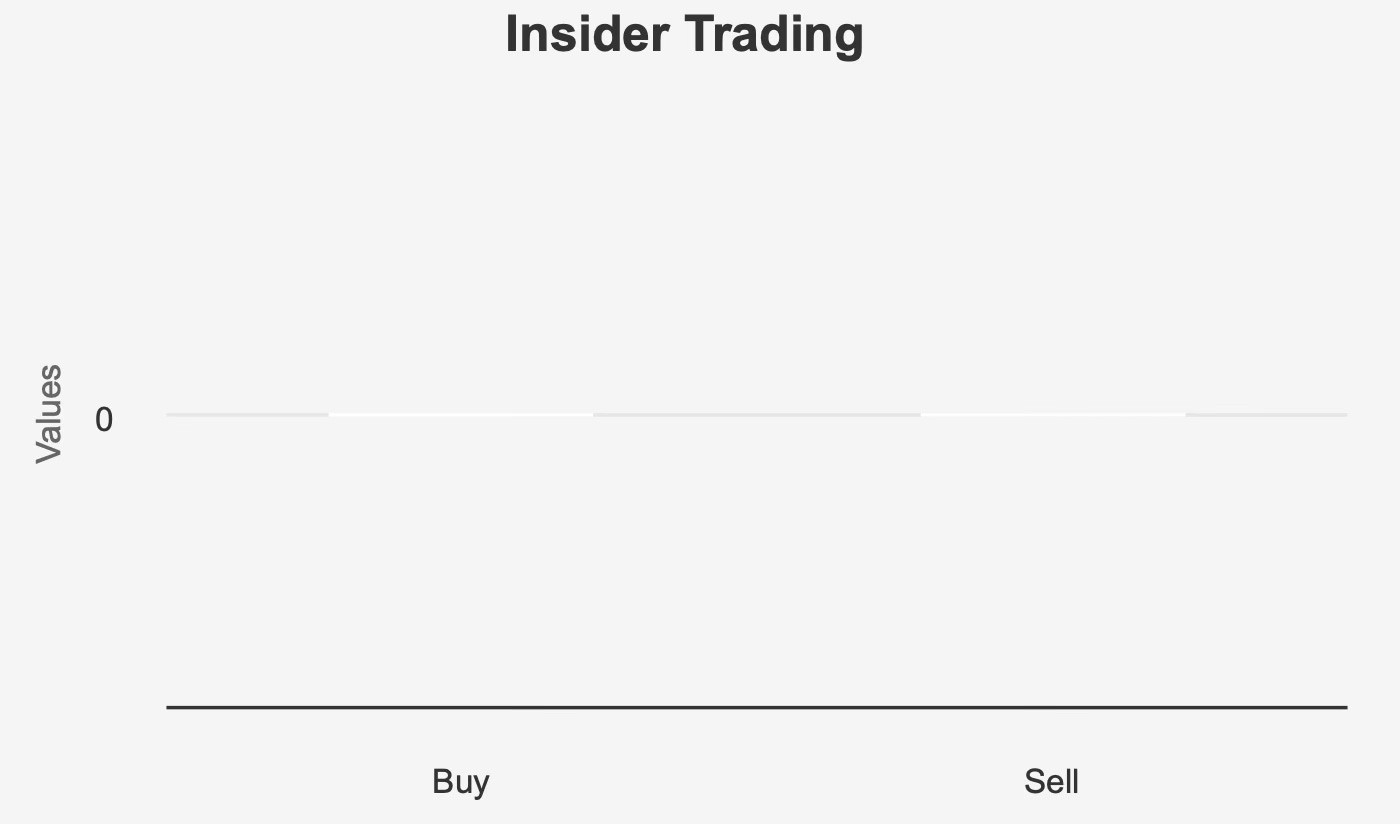
Return on invested capital trailing the weighted average cost of capital reinforces concerns about inefficient capital deployment. In addition, insider ownership stands at 0%, and institutional ownership is limited to 1.81%. The absence of insider trading activity over the past year suggests limited alignment or signaling from management.
Liquidity conditions further complicate the investment case. Daily trading volume is reported at zero, with an average of 1,049 shares over the past two months. Such limited liquidity may lead to wider bid-ask spreads and execution challenges, particularly for larger positions.
The Dark Pool Index of 40% indicates that a significant share of trading occurs off-exchange, potentially reducing transparency in price discovery.
Taken together, these risk indicators elevate the probability that operational setbacks could translate into financial stress. The high dividend yield must therefore be interpreted within a high-risk framework.
Final Assessment
Bridgemarq Real Estate Services presents a compelling yet conflicted dividend investment case. The stock trades at a substantial 59.3% discount to estimated intrinsic value and offers a forward yield of 9.6%, both of which are difficult to ignore in an income-oriented portfolio.
Yet beneath that surface appeal lies a business experiencing margin compression, negative earnings, declining returns on capital, and elevated leverage. ROIC has fallen below WACC, free cash flow multiples are stretched, and dividend coverage is negative. Financial risk indicators, including a 0.3 Altman Z-score and 5.04 Debt-to-EBITDA, underscore structural fragility.
If revenue growth translates into restored margins and normalized earnings, the valuation gap could narrow meaningfully. However, until capital efficiency improves and earnings stabilize sustainably, the stock carries characteristics consistent with a potential value trap.
For investors with a high tolerance for risk and a long time horizon, the margin of safety may justify a measured allocation. For more conservative income investors prioritizing dividend durability, caution remains warranted.
Bridgemarq offers yield and theoretical upside, but it demands disciplined risk assessment.