
Boston Pizza Royalties Income Fund: Attractive Yield, Limited Margin of Safety
Balancing Stable Cash Flows Against Elevated Valuation

Investment Thesis: High Current Income Supported by Stable Royalty Economics but Limited Upside at Present Valuation
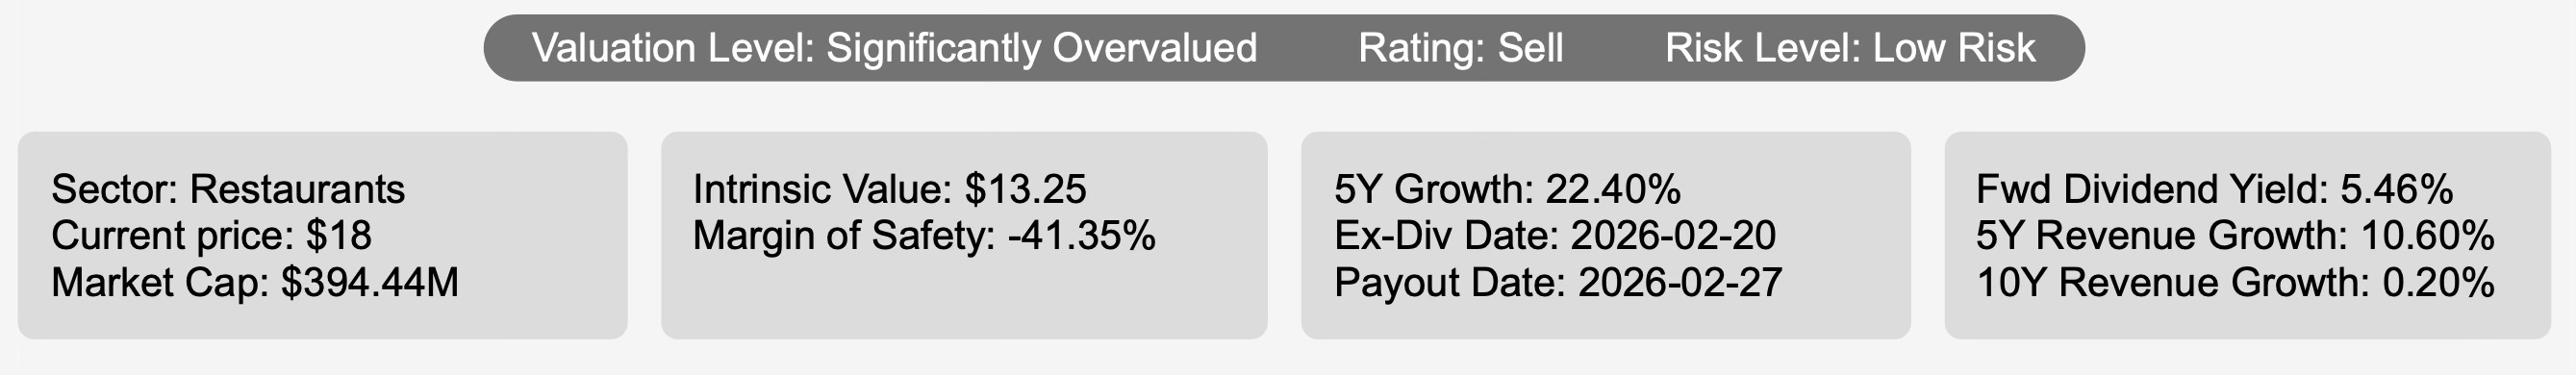
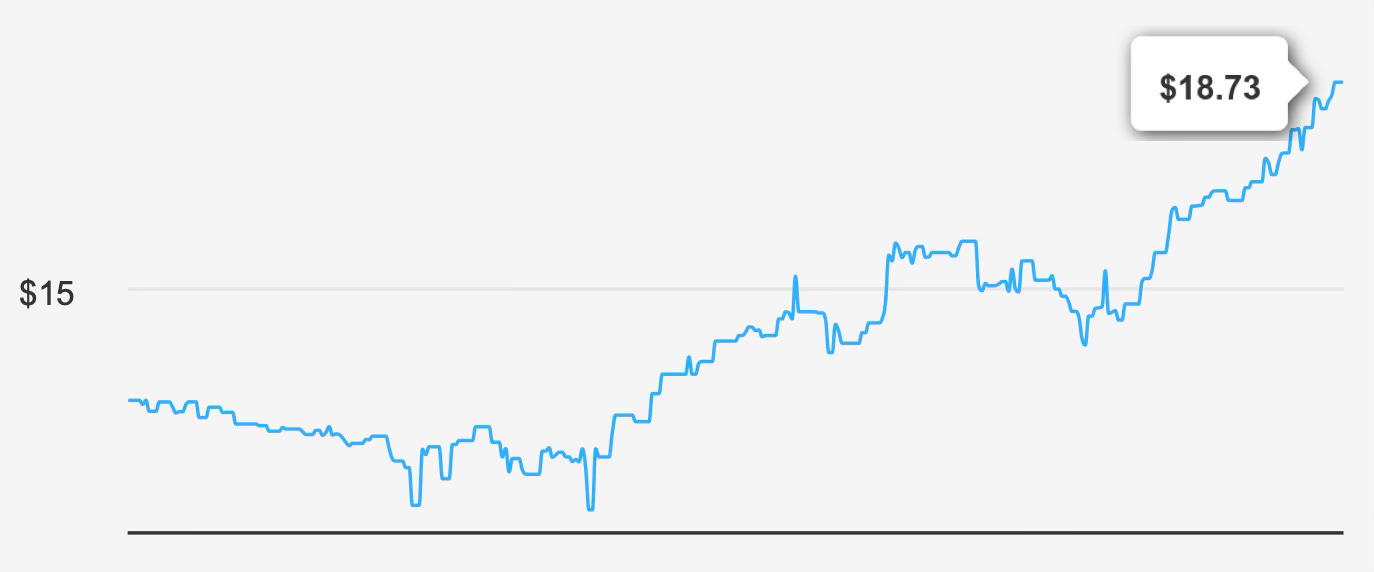
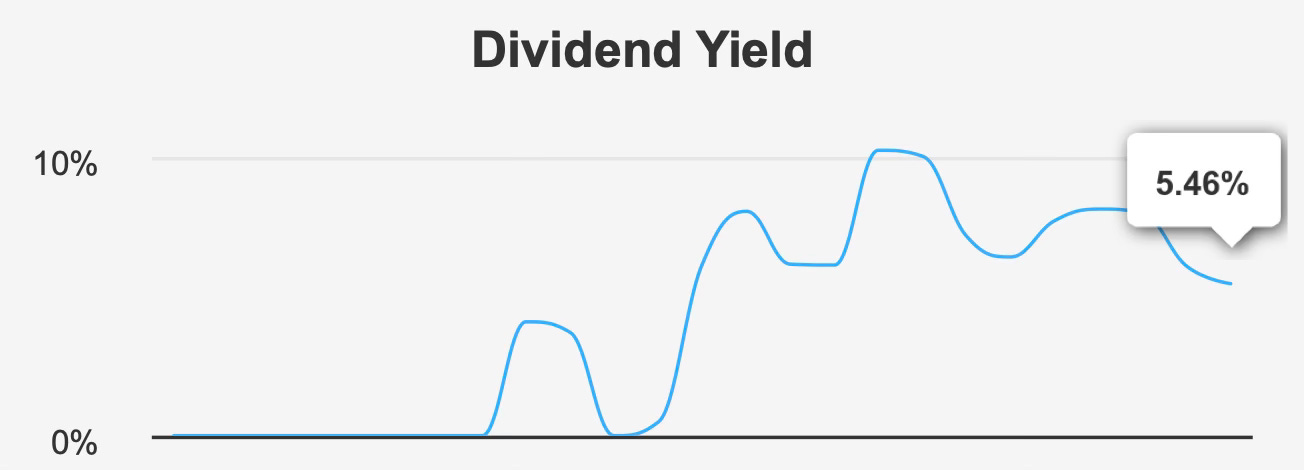
Boston Pizza Royalties Income Fund operates as a limited-purpose, open-ended trust that collects royalties from Boston Pizza restaurants and distributes substantially all available cash to unitholders. This structure inherently positions the fund as an income-oriented vehicle rather than a growth compounder. At a current price of $18, the units offer a forward dividend yield of 5.5%, which will appeal to yield-focused investors seeking monthly cash flow. The next ex-dividend date is February 20, 2026, with payment scheduled for February 27, 2026, consistent with its 12-times-per-year distribution pattern.
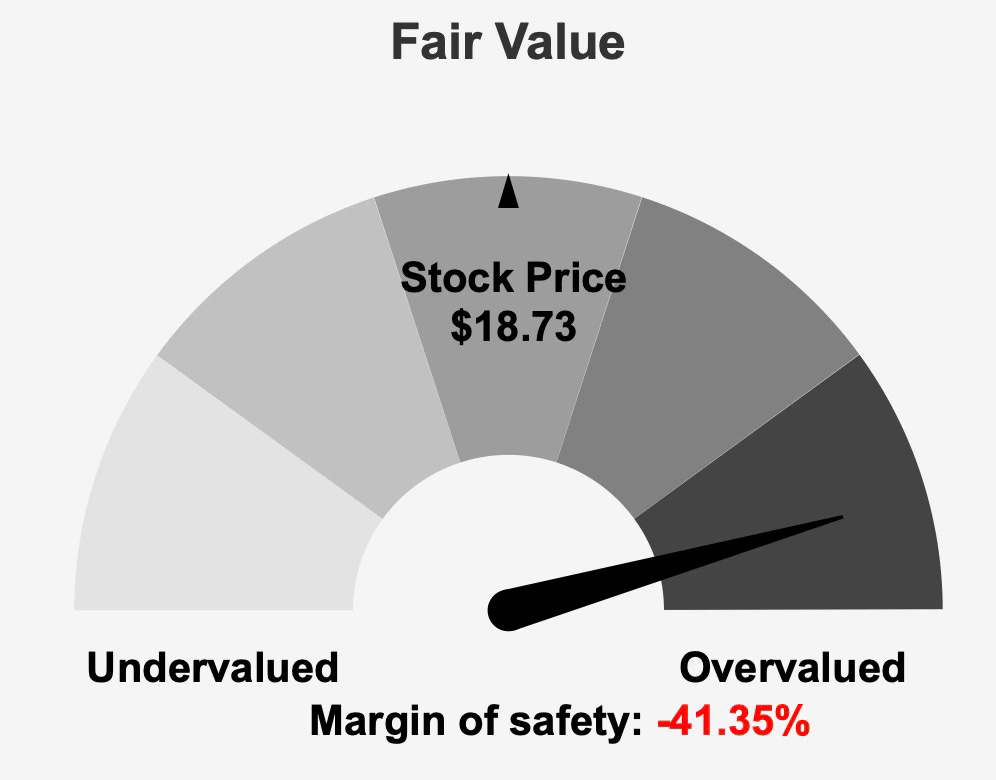
However, the income case must be weighed against valuation. The fund’s intrinsic value is estimated at $13.25, implying a negative margin of safety of approximately 41.4% at current levels. With a market capitalization of $394.4 million, units are trading materially above their assessed fair value. While the underlying royalty model provides relative stability and low operational complexity, investors today are effectively paying a premium for that stability.
The five-year dividend growth rate of 22.4% appears strong on the surface, yet more recent trends suggest moderation. Revenue growth has averaged 10.6% over five years but only 0.2% over the past decade, signaling that long-term expansion has been limited. Analysts project revenue of $38.34 million in 2026 and $39.07 million in 2027, reflecting modest forward growth broadly in line with the industry’s expected 3% annual expansion. The trust’s structural income characteristics remain intact, but valuation leaves little room for disappointment.
In sum, the fund offers dependable distributions backed by a royalty stream, but current pricing significantly compresses prospective total returns.
2. Earnings Momentum & Profitability Trends
Earnings momentum has been uneven in recent quarters. For the fourth quarter of 2025, earnings per share excluding non-recurring items were $0.177, down from $0.222 in the prior quarter and $0.23 in the comparable quarter a year earlier. On a diluted basis, however, EPS improved to $0.377 from $0.354 in Q3 2025 and $0.218 in Q4 2024, highlighting the effect of non-recurring adjustments and potential volatility in reported results.
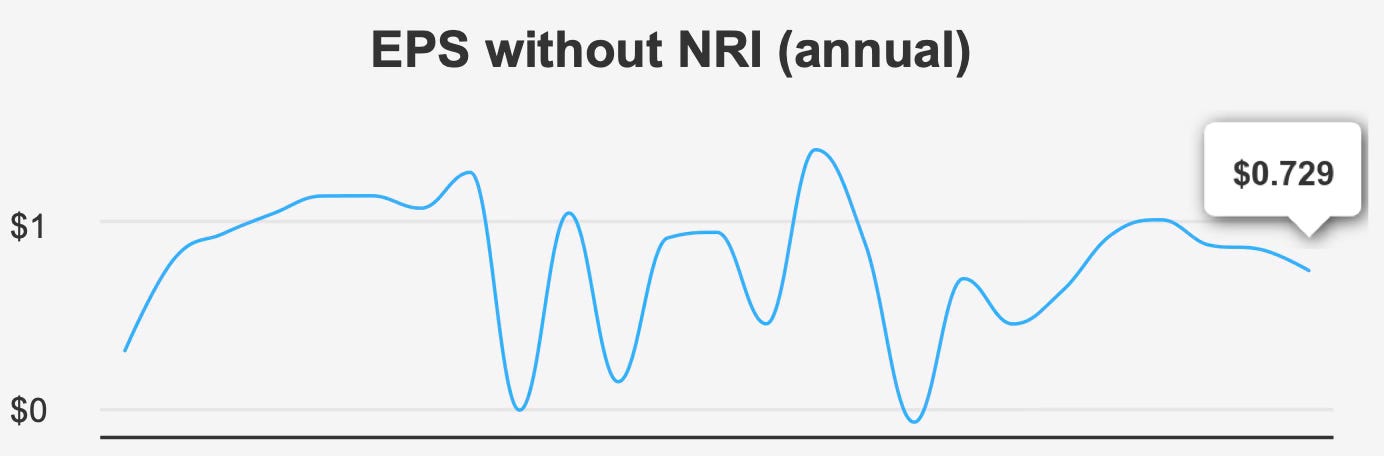
Revenue per share was $0.384 in Q4 2025, slightly below the $0.39 reported in Q3 but ahead of the $0.356 recorded a year earlier. Over the past five years, annual EPS excluding non-recurring items has compounded at 15.2%, yet there has been no growth over the past decade. That divergence underscores the reality that recent recovery has not translated into sustained long-term earnings expansion.
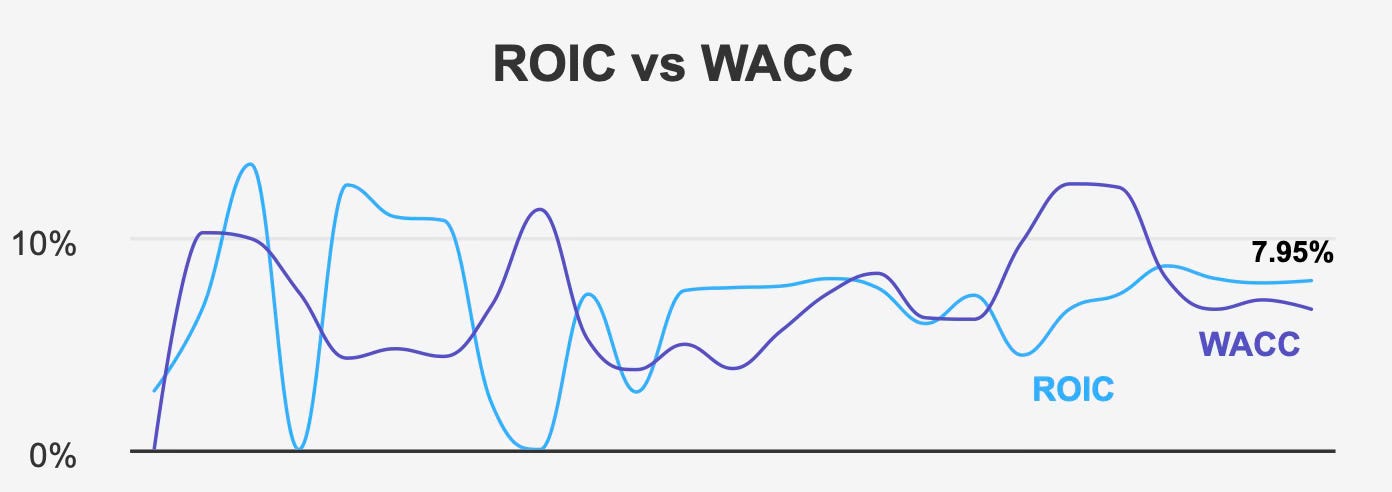
From a capital efficiency standpoint, the trust currently generates a return on invested capital of 7.9%, modestly exceeding its weighted average cost of capital of 6.6%. This positive spread indicates ongoing economic value creation. Over the past decade, ROIC has reached a high of 8.6% and maintained a median of 7.5%, reflecting consistent though not accelerating capital efficiency. Looking at the more recent five-year period, the median ROIC of 7.7% compares with a median WACC of 8.0%, suggesting that value creation has at times been marginal.
The absence of meaningful share repurchases also shapes per-unit economics. There were no buybacks in the past year, and the three-year buyback ratio stands at just 0.4%. Over the last decade, the buyback ratio is negative at 0.3%, indicating that more units were issued than repurchased. While dilution has not been dramatic, it does limit per-unit growth over extended periods.
Overall, earnings trends point to stability rather than acceleration. Returns on capital remain adequate relative to funding costs, but the trust’s economic model does not appear positioned for sustained high-growth expansion.
3. Dividend Profile & Sustainability
Income is the central pillar of the investment case. The forward dividend yield of 5.5% stands well above broader market averages and is distributed monthly, an attractive feature for income-oriented investors.
Yet the sustainability profile warrants careful attention. The current payout ratio is approximately 140%, materially above the 10-year median of 101.1%. While royalty trusts are structured to distribute most available cash, a payout ratio at this level leaves limited flexibility for adverse operating conditions or unexpected disruptions. Dividend coverage is reported at 1.34, providing some support, but the elevated payout ratio constrains future growth potential.
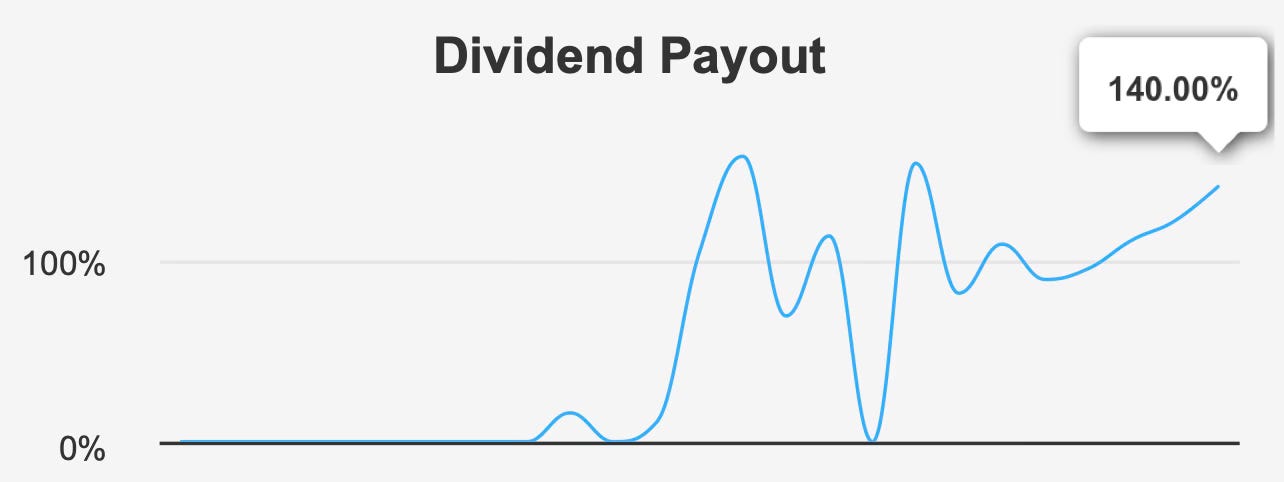
Indeed, while five-year dividend growth has averaged 22.4%, the three-year growth rate has moderated to 8.2%, and the forecasted three- to five-year dividend growth rate is projected at 0%. This expected stagnation aligns with the modest revenue outlook and elevated payout metrics. In practical terms, investors should view the current yield as largely static rather than growing.
Balance sheet leverage remains manageable. Debt-to-EBITDA stands at 1.5x, comfortably below levels typically associated with financial strain. This moderate leverage supports the trust’s low-risk designation and underpins its ability to maintain distributions in the near term.
However, sustainability risks extend beyond leverage. The Altman Z-score of 2.25 places the trust in the grey zone, signaling some degree of financial vulnerability that merits monitoring. On a more positive note, the Beneish M-Score of -2.55 suggests a low probability of earnings manipulation, supporting confidence in reported figures.
Taken together, the dividend appears stable in the near term but offers little visibility for growth. With payout levels already elevated, any downturn in royalty revenues could pressure distributions.
4. Valuation Analysis: Premium Pricing Relative to Intrinsic Value and Historical Benchmarks
Valuation is where the investment case becomes more challenging. The intrinsic value is estimated at $13.25, compared with a current trading price of $18.73, producing a negative margin of safety of roughly 41.4%. Investors purchasing at today’s levels are paying materially above modeled fair value.
On an earnings basis, the trailing P/E ratio stands at 13.7x, slightly above its 10-year median of 13.5x. While this multiple does not appear extreme in isolation, the forward P/E of 14.9x indicates modest multiple expansion relative to historical norms. Given the absence of strong forward earnings growth projections, this premium appears difficult to justify.
The trailing EV/EBITDA ratio of 10.1x sits just below the 10-year median of 10.8x, suggesting enterprise valuation is broadly in line with long-term averages. However, other metrics imply richer pricing. The price-to-free-cash-flow ratio of 15.8x exceeds its historical median of 11.9x, signaling that investors are paying a premium for current cash generation. Meanwhile, the price-to-book ratio of 1.9x stands at a 10-year high, indicating that units trade at the richest level relative to net assets in a decade.
Compounding valuation concerns, the dividend yield currently sits at a three-year low, diminishing the relative income appeal compared with its own recent history. When a high-yield security trades at elevated price-to-book and price-to-cash-flow multiples while offering a lower relative yield, total return expectations naturally compress.
In short, while absolute multiples are not extreme, the combination of limited growth, high payout ratios, and pricing above intrinsic value suggests that the risk-reward balance is skewed unfavorably at present levels.
5. Risk Assessment & Capital Structure Considerations
From a risk standpoint, Boston Pizza Royalties Income Fund carries a mixed profile.
Operationally, the royalty structure insulates the trust from many direct cost pressures, contributing to relatively steady cash flows. ROIC exceeding WACC reinforces the notion that the business continues to generate economic value. Debt metrics remain moderate, with Debt-to-EBITDA at 1.5x, providing balance sheet flexibility.
However, liquidity presents a meaningful concern. Average daily trading volume over the past two months has been just 1,351 shares, and certain days have recorded zero trades. Such thin liquidity can result in wide bid-ask spreads and difficulty executing sizable transactions without price impact. Investors requiring flexibility or institutional-scale liquidity may find the units less accommodating.
Dark pool activity is also elevated, with a DPI Buy of 77% and DPI Sell of 87%, indicating a significant portion of trades occur outside public exchanges. While not inherently negative, this dynamic can reduce price transparency.
Ownership structure adds another dimension. Insider ownership stands at 0%, and there has been no insider buying or selling over the past 12 months. Institutional ownership is limited at 4.6%. The absence of insider alignment and limited institutional participation may temper confidence for some investors.
Finally, revenue growth has decelerated over longer horizons, and projected growth remains modest. With a payout ratio already at 140%, limited growth combined with valuation compression could lead to underwhelming total returns even if the dividend remains intact.
Final Assessment
Boston Pizza Royalties Income Fund offers a dependable monthly income stream supported by a straightforward royalty model and manageable leverage. The current 5.5% forward yield remains attractive in absolute terms, and capital efficiency metrics show the trust continues to earn modestly above its cost of capital.
Yet the investment case is constrained by valuation. Units trade approximately 41% above intrinsic value, price-to-book sits at a 10-year high, and cash flow multiples exceed historical medians. Dividend growth is expected to flatten, and the payout ratio leaves limited room for expansion.
For existing unitholders focused on income, the stability of distributions may justify continued ownership, provided expectations are aligned with low growth and potential valuation compression. For prospective investors, however, the lack of margin of safety materially reduces the appeal. A more attractive entry point closer to intrinsic value would meaningfully improve the balance between income, risk, and long-term return potential.
At present levels, the trust appears priced for stability rather than opportunity.