
Blue Owl Capital: Yield Without Coverage
Elevated payout meets weak capital returns and a negative margin of safety

Investment Thesis: Elevated Yield Masks Structural Value Destruction and Capital Efficiency Challenges
Blue Owl Capital Inc. OWL 0.00%↑ operates as one of the world’s largest alternative asset managers, overseeing $295.6 billion in total assets under management as of September 2025, including $183.8 billion in fee-earning AUM. Its platform spans global private equity, private credit, and real estate/real assets, serving a client base comprised of 68% institutional capital and 32% high-net-worth investors. The firm’s scale and diversified asset base position it prominently within the alternative asset management landscape.
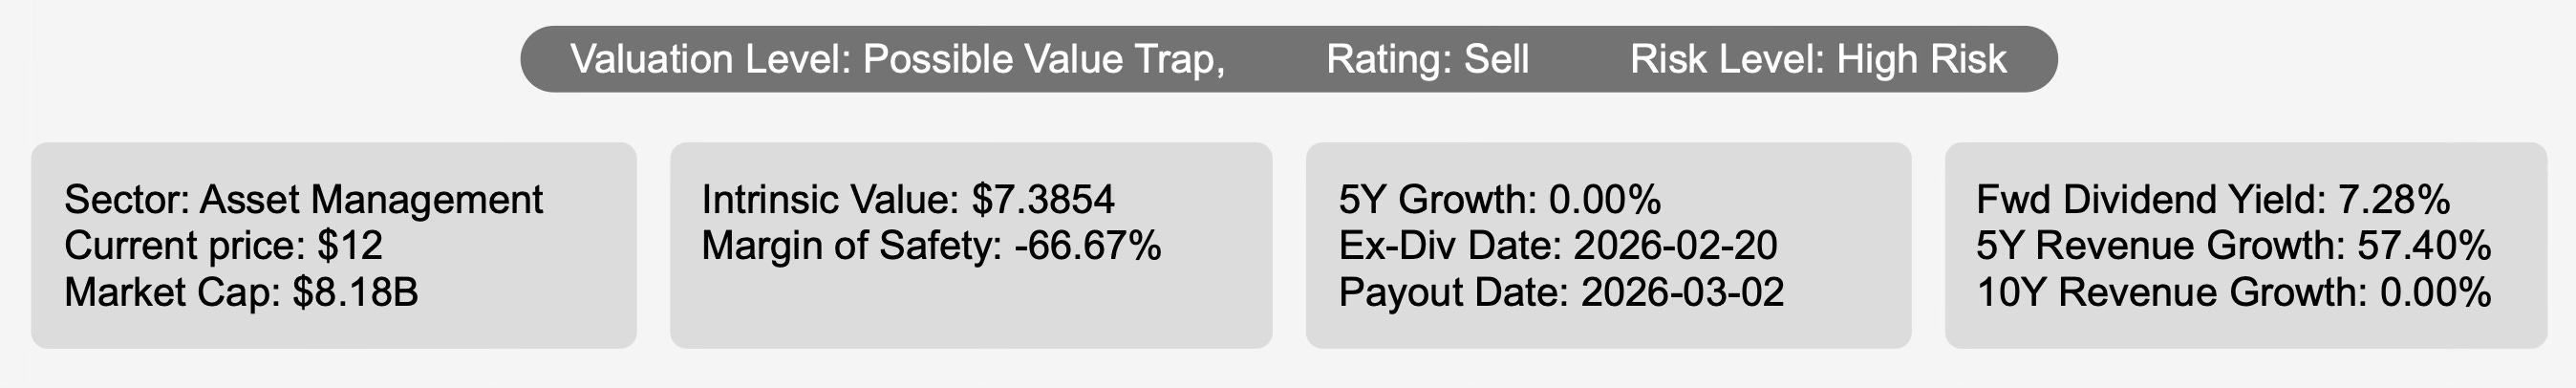
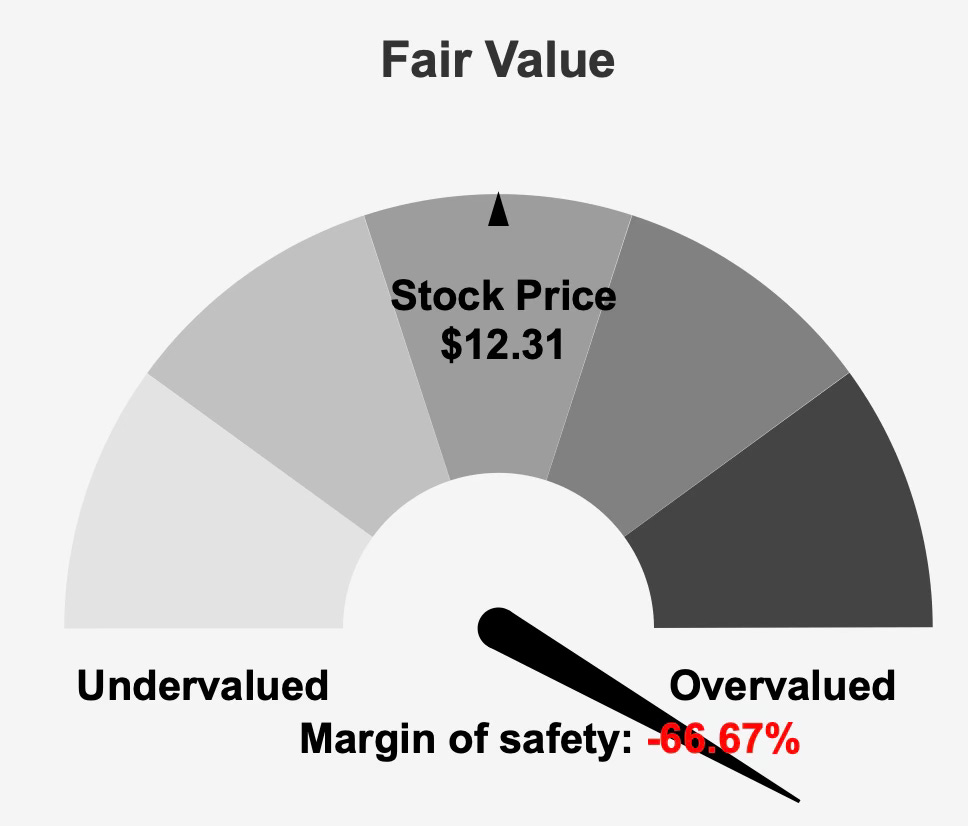
Yet scale alone does not translate into shareholder value creation. The stock currently trades at $12 against an intrinsic value of $7.39, implying a negative margin of safety of -66.6%. The firm is formally categorized as a possible value trap with a Sell rating and High Risk designation. This classification reflects not only valuation concerns but also weak economic profitability and balance sheet pressures.
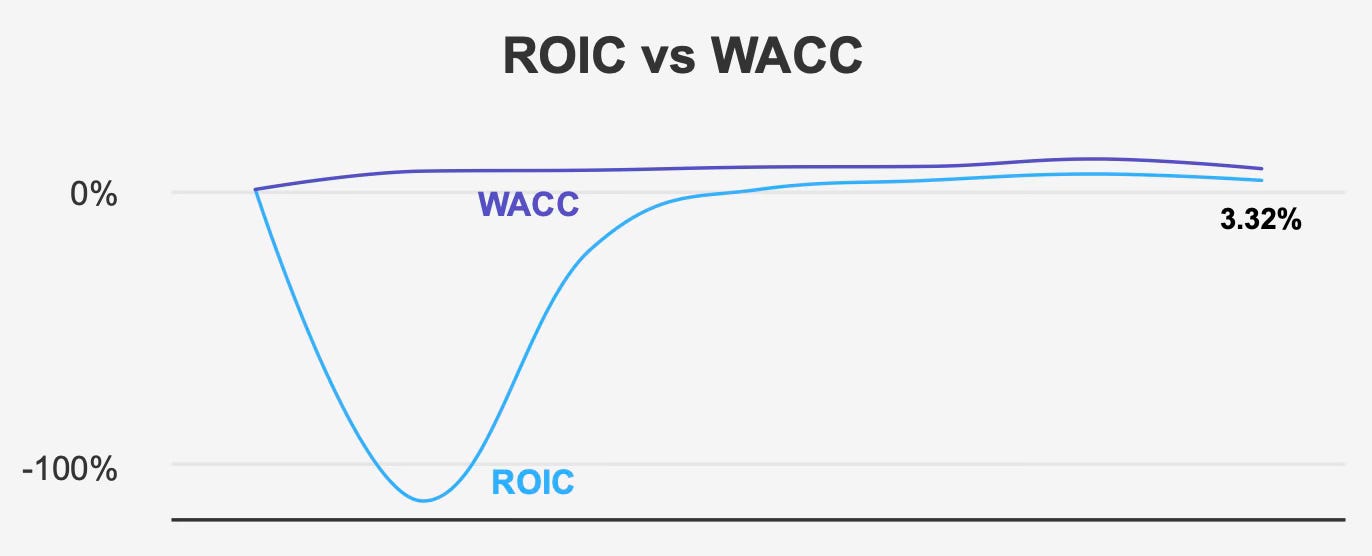
The central issue is not revenue growth, which has been strong, but rather the inability to convert that growth into durable economic returns. Return on invested capital currently stands at 3.3%, materially below the 7.6% weighted average cost of capital. When a company consistently earns below its cost of capital, it destroys value rather than creates it. That dynamic frames the investment debate.
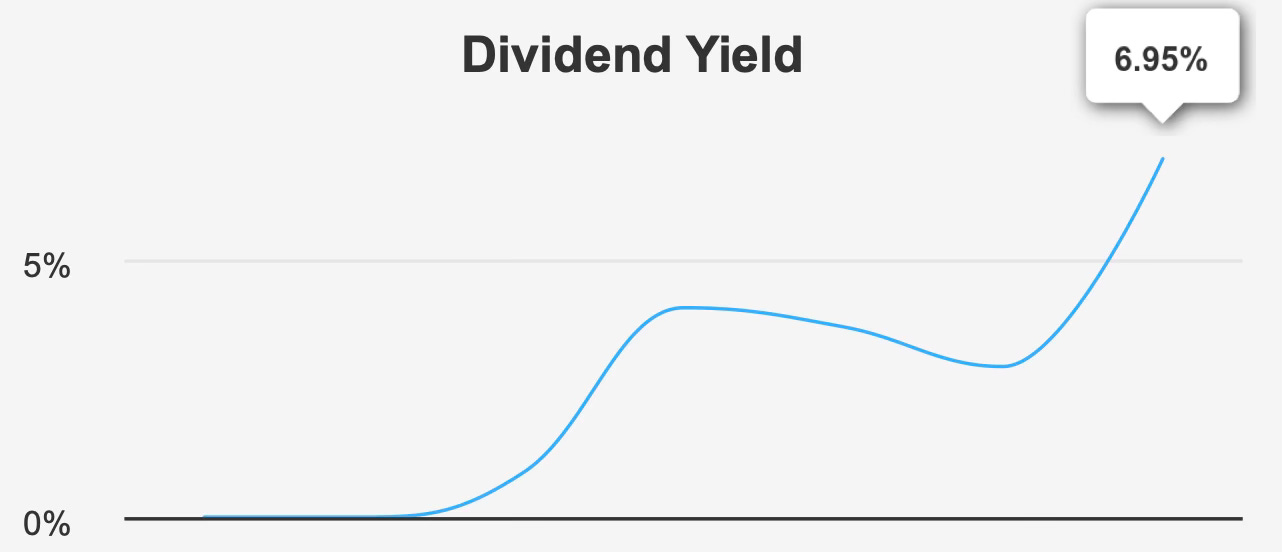
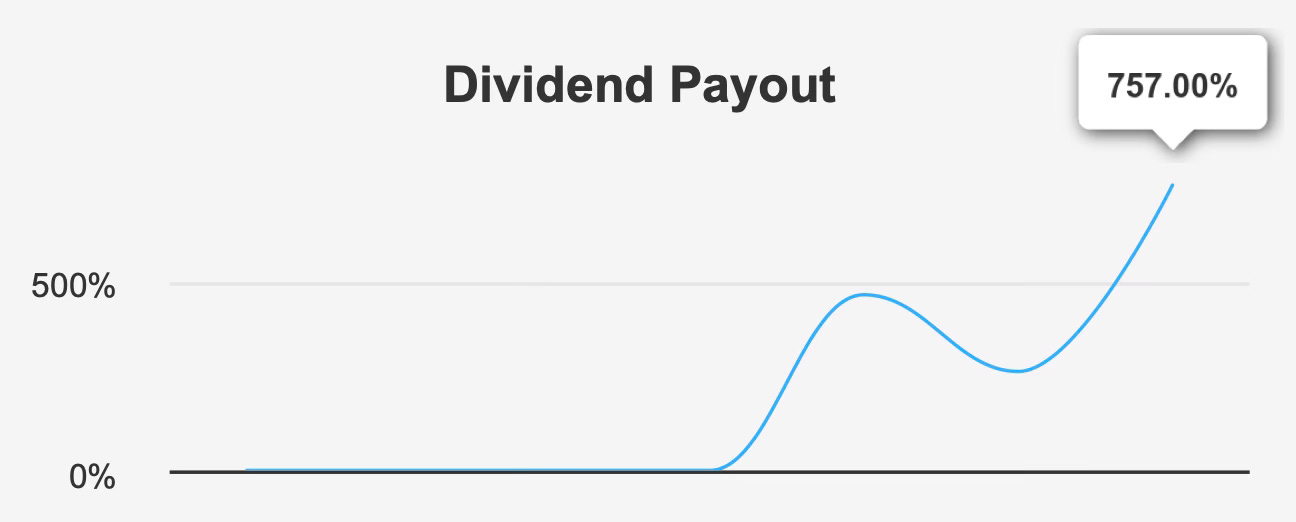
While the forward dividend yield of 7.3% appears attractive, sustainability metrics are deeply strained. A payout ratio of 757.0%, combined with weak coverage and elevated leverage, undermines confidence in the durability of the income stream. The yield is high for a reason.
For long-term dividend investors, the question is not whether Blue Owl can grow assets, but whether it can translate scale into returns that exceed its capital costs while simultaneously supporting its distribution commitments. At present, the data suggests that balance remains unfavorable.
Earnings Momentum & Profitability Trends: Revenue Expansion Without Durable Earnings Power
Blue Owl’s revenue trajectory has been robust. Five-year revenue growth stands at 57.4%, reflecting strong asset gathering and expansion across its platform. In the most recent quarter ended September 30, 2025, revenue per share rose to $1.08, modestly above $1.072 in the prior quarter and sharply higher than $0.403 in the same quarter last year. That year-over-year improvement highlights the firm’s growing scale.
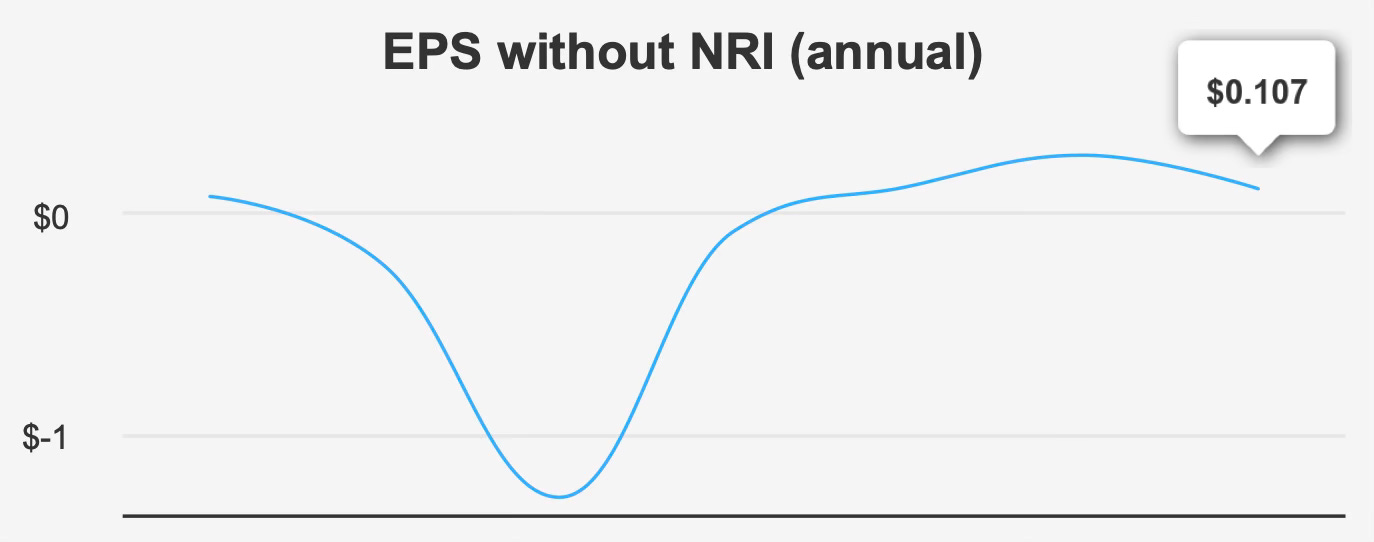
However, earnings quality remains inconsistent. EPS excluding non-recurring items declined to -$0.002 in the latest quarter, down from $0.023 in the previous quarter and $0.042 a year earlier. Diluted EPS came in at $0.01, compared with $0.02 sequentially and $0.04 year over year. Over both five- and ten-year periods, annual EPS growth has remained flat at 0.0%, underscoring the absence of sustained profitability expansion.
Gross margin improved materially to 53.1%, exceeding the five-year median of 34.7% and approaching the ten-year high of 55.7%. On the surface, this suggests improved operating efficiency. Yet margin expansion has not translated into durable net earnings growth, raising questions about expense structure, capital intensity, and financing costs.
Capital allocation trends further complicate the picture. Share buyback ratios over one-, three-, and five-year periods stand at -17.0%, -14.5%, and -13.5%, respectively. Negative figures indicate dilution, meaning shares outstanding have increased rather than declined. In a business struggling to generate excess returns, dilution compounds the challenge by spreading earnings across a growing share base.
Looking forward, analyst projections imply a potential earnings recovery. Revenue estimates for the next three fiscal years are $2,682.8 million, $3,093.4 million, and $3,559.2 million. Estimated EPS for the next fiscal year is $0.615, rising to $0.854 the following year. If achieved, that trajectory would materially improve earnings coverage metrics.
The next earnings report is expected on May 1, 2026. For investors, that release will serve as a critical checkpoint to assess whether forward projections represent a genuine inflection point or simply cyclical volatility within an earnings profile that has historically lacked consistency.
Dividend Profile & Sustainability: High Yield Supported by Aggressive Distribution Policy
Blue Owl currently offers a forward dividend yield of 6.95%, well above its historical median yield of 3.5%. Yield expansion of this magnitude often reflects a combination of increased distributions and share price pressure. In this case, it is the latter that raises caution.
Dividend growth has been uneven. The three-year dividend growth rate per share stands at 73.6%, signaling a strong recent acceleration. However, the five-year growth rate remains 0.0%, indicating that the company previously experienced a prolonged period of stagnation before the recent surge.
More concerning is the payout ratio, which stands at 757.0%, compared with a ten-year median of 103.6%. Such an elevated payout ratio indicates that dividends materially exceed earnings. Dividend coverage is just 0.07, leaving little room for earnings volatility or macroeconomic stress.
Leverage compounds these concerns. The firm’s Debt-to-EBITDA ratio is 4.84, above moderate risk thresholds. Over the past three years, the company has issued $1.7 billion in long-term debt. Elevated leverage reduces financial flexibility and increases vulnerability during market downturns—particularly problematic for an alternative asset manager whose performance can be cyclical.
Management projects dividend growth of 13.5% over the next three to five years. That outlook presumes meaningful earnings expansion and stable capital markets. Without sustained improvement in ROIC and coverage ratios, however, dividend growth ambitions could prove difficult to sustain.
The most recent ex-dividend date was February 20, 2026, with the next expected around May 20, 2026. While the quarterly cadence supports income predictability, sustainability remains the key variable.
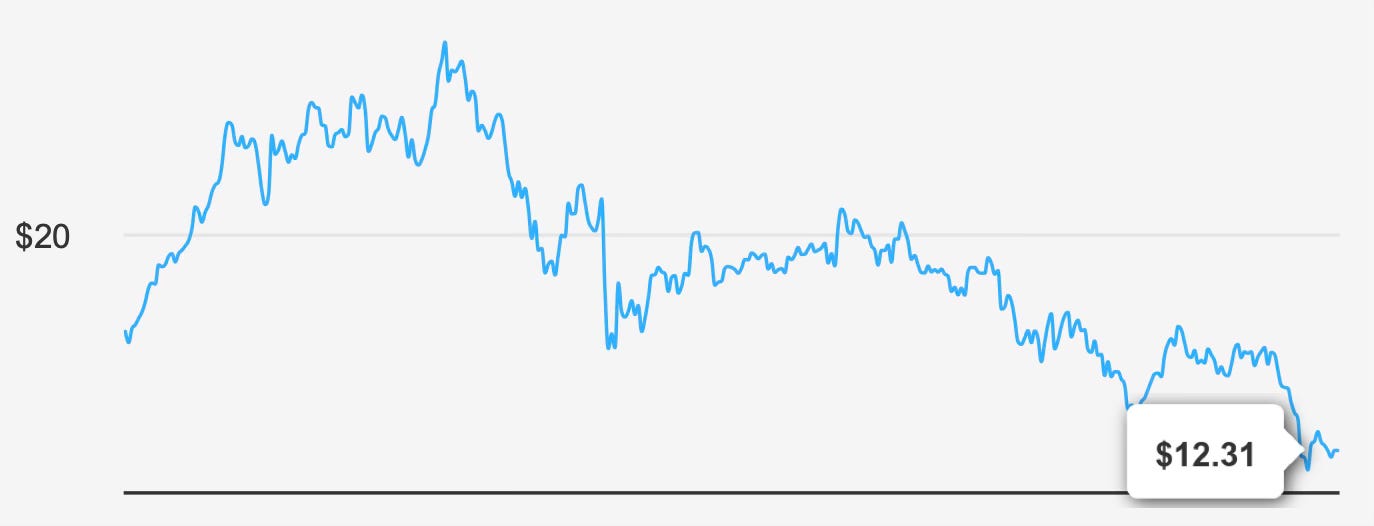
Valuation Analysis: Market Price Reflects Optimism Despite Negative Margin of Safety and Historical Volatility
At a market price of $12.31 versus an intrinsic value estimate of $7.39, Blue Owl trades at a -66.6% margin of safety. That gap indicates meaningful overvaluation relative to discounted cash flow assessments.
The forward P/E ratio of 13.0x appears reasonable in isolation and sits far below the ten-year median of 252.0x. However, the trailing P/E remains elevated at 205.2x, reflecting depressed current earnings. The divergence between forward and trailing multiples signals heavy reliance on projected recovery rather than demonstrated profitability.
On a sales basis, the trailing P/S ratio of 2.9x sits near its ten-year low. Similarly, EV/EBITDA at 20.0x is below the historical median of 22.3x. Price-to-book at 3.6x trails the ten-year median of 4.0x, while price-to-free-cash-flow at 6.9x also sits near historical lows. These relative valuation measures suggest that, compared to its own history, the stock is not at peak valuation.
Yet valuation must be contextualized. A business generating ROIC of 3.3% against a 7.6% cost of capital does not warrant premium multiples. When value destruction persists, discounted multiples can be justified.
Analyst sentiment reflects tempered optimism. The current price target of $17.96 has declined from $21.63 over the past three months. Downward revisions suggest expectations are moderating. While some valuation metrics appear supportive, the negative margin of safety and capital efficiency gap dominate the risk-reward profile.
Risk Assessment & Capital Structure Considerations: Leverage, Liquidity, and Economic Returns Under Pressure
The most pressing structural concern is economic value destruction. With ROIC at 3.3% and WACC at 7.6%, Blue Owl fails to earn its cost of capital. The five-year median ROIC of -0.02% further illustrates historical difficulty in generating positive economic spreads.
The Altman Z-score of 0.96 places the firm in the distress zone, indicating elevated bankruptcy risk within two years under traditional models. Combined with a Debt-to-EBITDA ratio of 4.84, leverage remains a central vulnerability.
Liquidity conditions also warrant monitoring. Current trading volume of 12.6 million shares trails the two-month average of 18.5 million. Additionally, 40% of trading occurs in dark pools, reducing transparency in price discovery and potentially amplifying volatility during periods of stress.
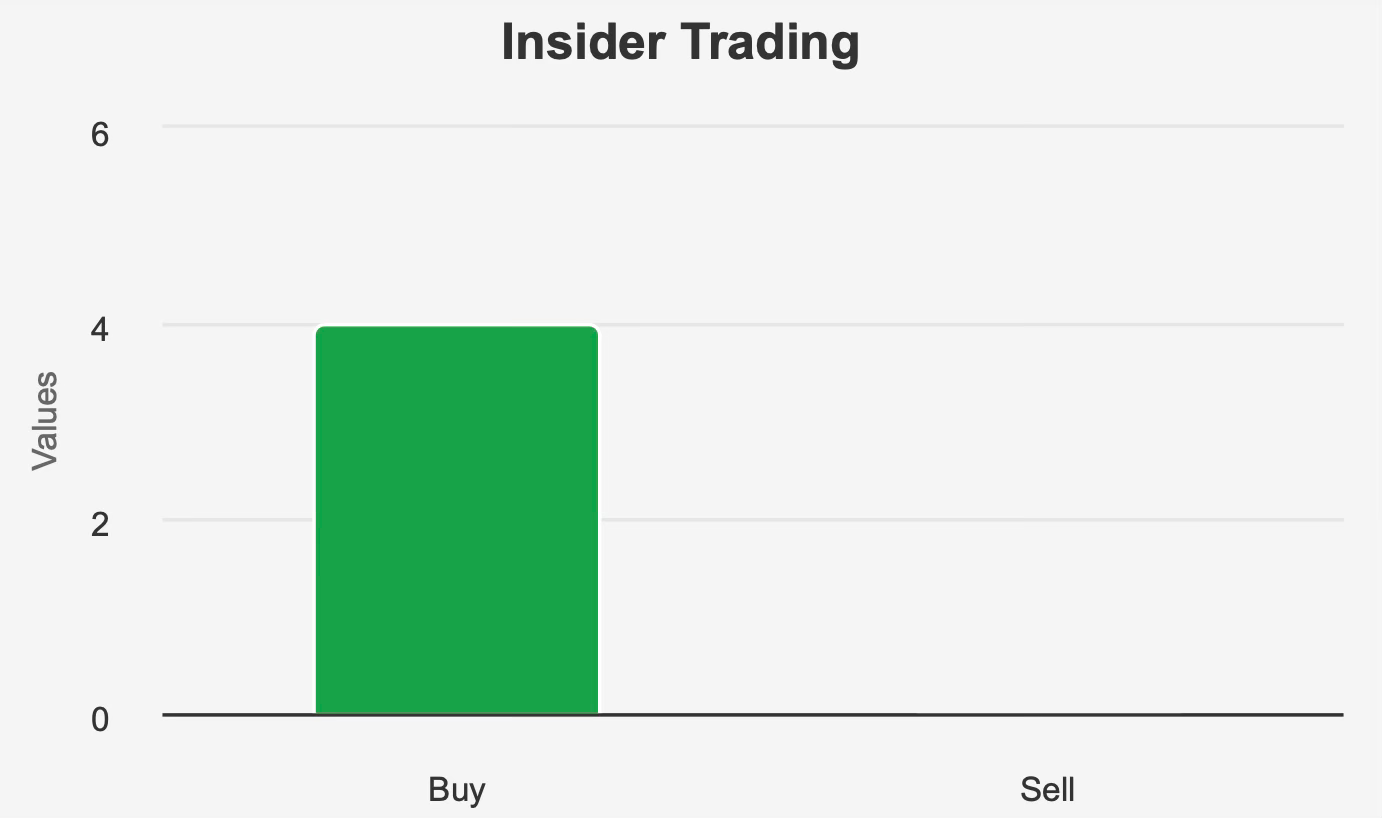
Institutional ownership stands at 97.2%, while insider ownership is just 0.39%. Over the past year, insiders executed four purchases totaling 474,670 shares, with no recorded sales. While insider buying suggests internal confidence, limited ownership reduces alignment magnitude.
Other indicators are mixed. The Beneish M-Score of -2.79 suggests a low likelihood of earnings manipulation. Government contract funding increased from $150,000 in 2022 to $200,000 in 2023, reflecting incremental diversification. Patent activity peaked at 24 filings in both 2020 and 2022 before declining to 16 in 2023, indicating continued though moderating innovation.
Ultimately, however, financial leverage and sub-cost-of-capital returns outweigh secondary positives. For a dividend investor, stability and coverage are paramount. At present, both remain pressured.
Final Assessment
Blue Owl Capital combines scale, strong asset growth, and an appealing headline yield. Revenue expansion and forward EPS projections suggest potential earnings improvement over the next two fiscal years. Relative valuation multiples have moderated, and insider buying signals some internal conviction.
Yet the structural picture remains challenging. A payout ratio of 757.0%, coverage of 0.07, leverage of 4.84x Debt-to-EBITDA, and ROIC materially below WACC collectively form a fragile foundation for dividend sustainability. The -66.6% margin of safety reinforces valuation concerns.
For investors prioritizing durable income supported by consistent economic value creation, the current profile appears misaligned with those objectives. Until Blue Owl demonstrates sustained improvement in capital efficiency and dividend coverage, the elevated yield should be viewed with caution rather than enthusiasm.