
Best Buy: A High-Yield Retailer Trading Below Its Economic Value
How capital allocation and earnings cycles shape long-term shareholder income

Investment Thesis: A Shareholder-Focused Retail Franchise Trading Below Long-Term Economic Worth
Best Buy BBY 0.00%↑ operates as the largest pure-play consumer electronics retailer in the United States, generating more than $41 billion in annual sales and holding roughly 8% share of the North American market and about one-third of offline category sales. The business remains heavily store-driven, although investments in fulfillment and omnichannel infrastructure have lifted e-commerce penetration to a mid-30% share of revenue following pandemic-era adoption.
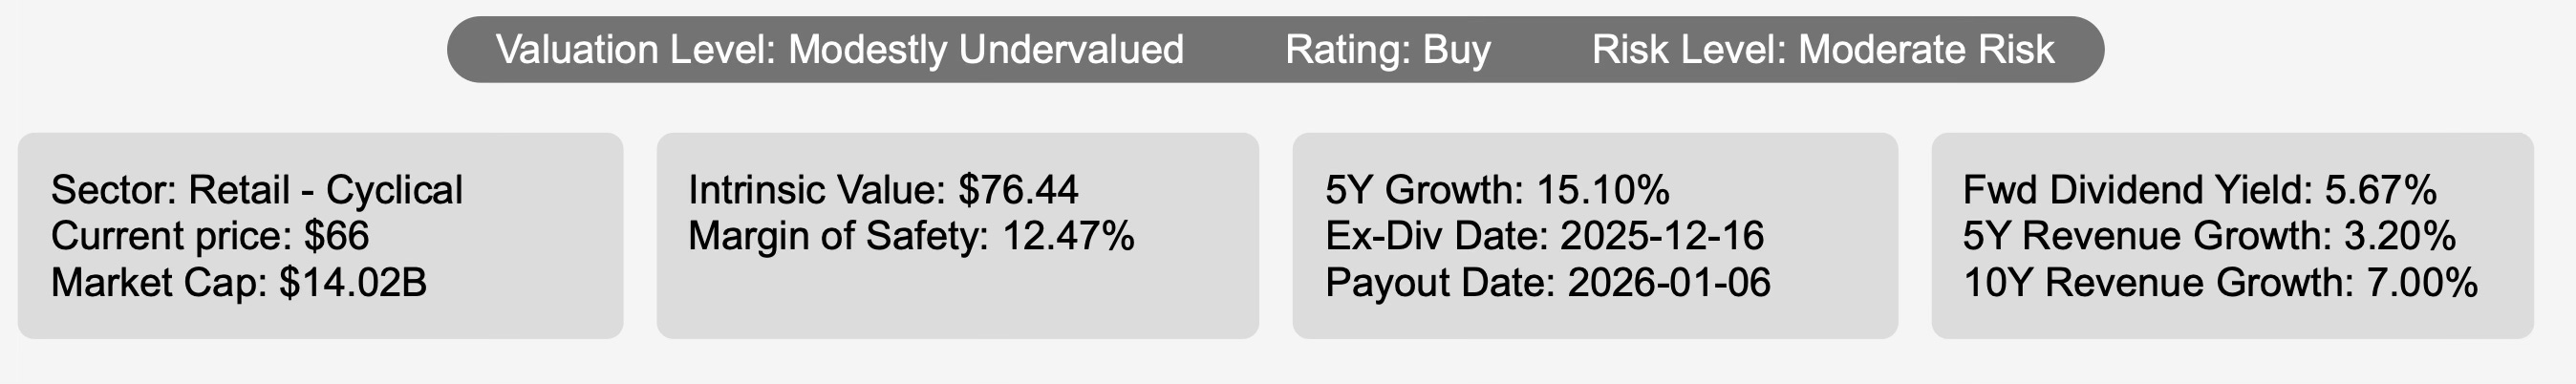
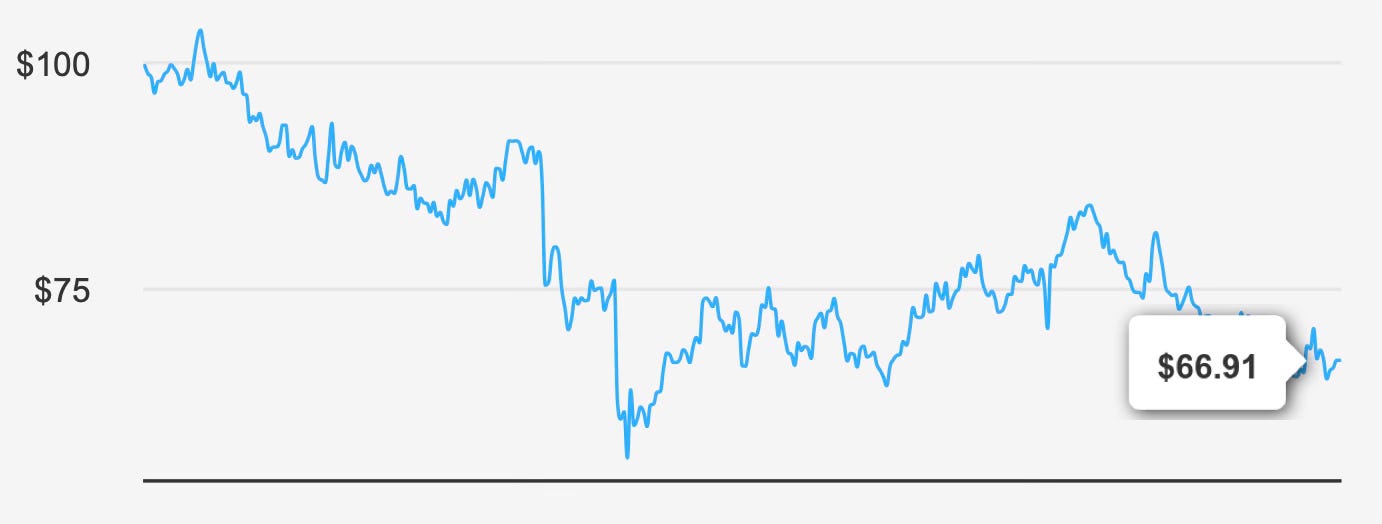
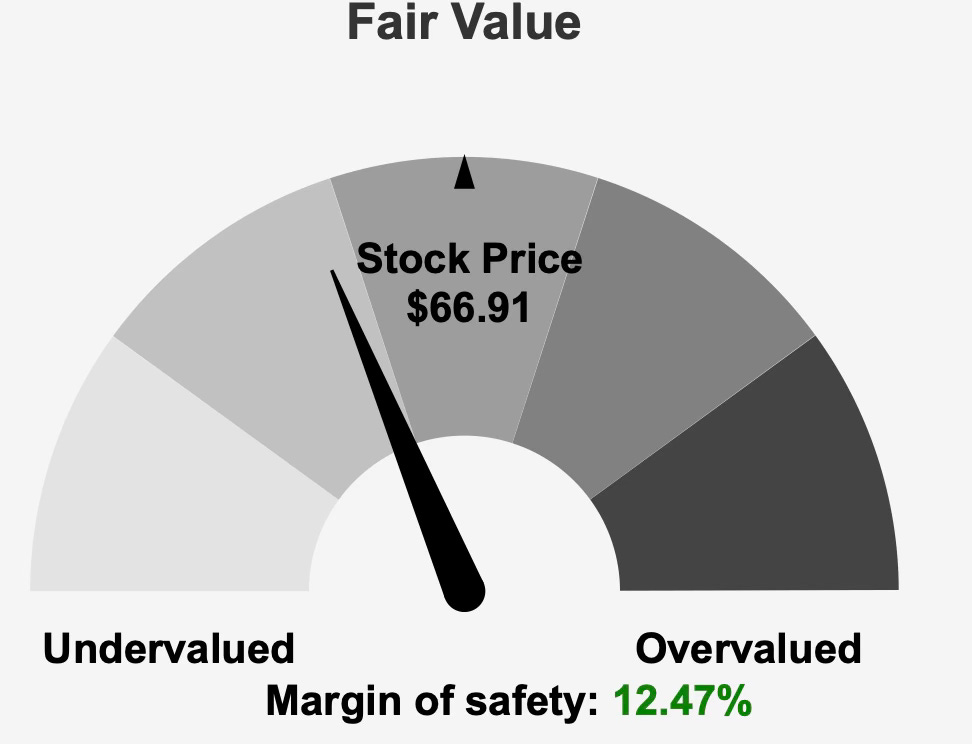
At the current share price near $66, the stock trades below an estimated intrinsic value of $76.44, implying a margin of safety of roughly 12.5%. The market appears to be pricing the company as a no-growth or declining retailer, yet the underlying economics tell a more nuanced story. The company consistently earns returns on invested capital above its cost of capital, maintains strong profitability metrics, and distributes a significant portion of earnings through dividends and repurchases.
The core investment question is therefore not whether Best Buy is a stable business — it demonstrably is — but whether cyclicality in consumer electronics demand justifies the discount applied to its shares.
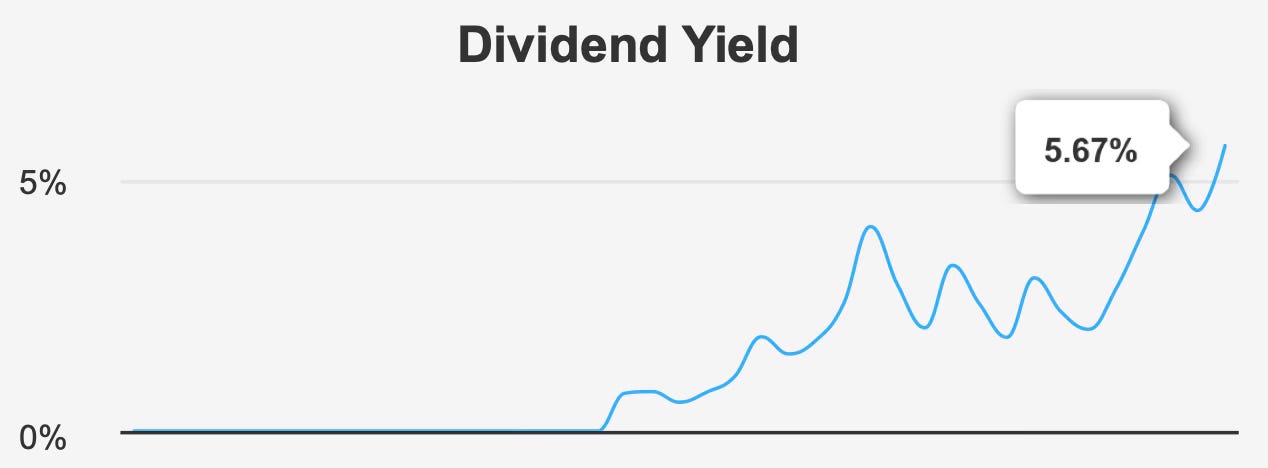
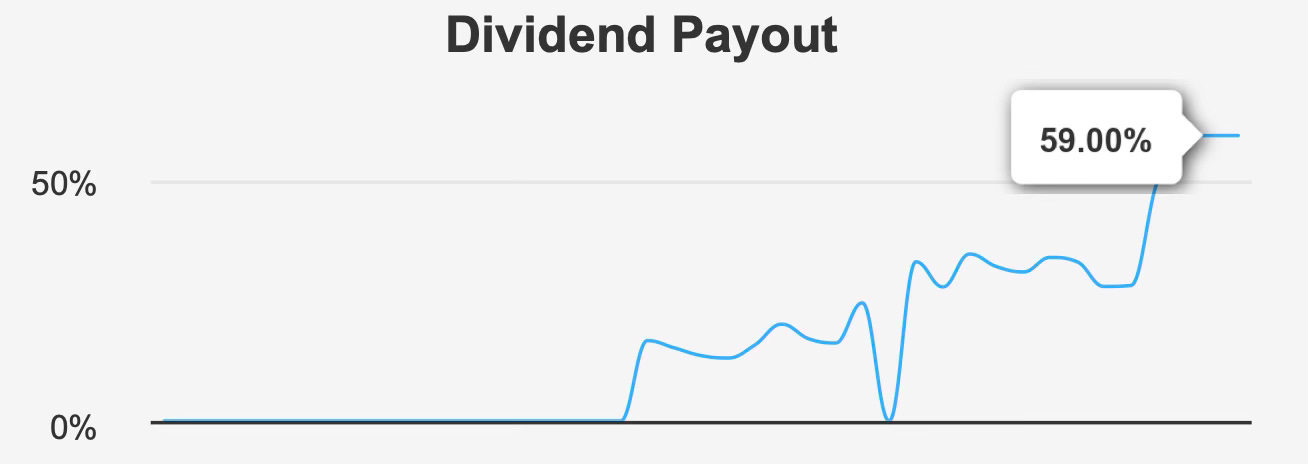
The current yield of 5.7% sits far above the company’s historical median yield of 2.8%, signaling investor skepticism rather than dividend weakness. The payout ratio remains within a sustainable range, and projected earnings growth supports continued distributions. The valuation discount appears tied primarily to declining operating margins and modest revenue growth rather than balance-sheet or liquidity stress.
In essence, Best Buy represents a classic income-value opportunity: a mature retailer facing cyclical pressures yet continuing to generate economic profits and returning substantial capital to shareholders. The market discount reflects uncertainty about growth durability, while the dividend and valuation metrics suggest a business priced for stagnation rather than collapse.
2. Earnings Momentum & Profitability Trends
Recent earnings data shows mixed but stable operational performance. For the quarter ending October 31, 2025, adjusted EPS reached $1.40, improving from $1.28 in the previous quarter and $1.26 year over year. The improvement in adjusted earnings contrasts with diluted EPS of $0.66, which declined due to non-recurring items, indicating accounting volatility rather than operational deterioration.
Revenue per share climbed modestly to $45.60 from $44.52 sequentially and $43.59 year over year, reflecting stable consumer demand rather than contraction. While long-term EPS growth has averaged 11.6% over ten years, the past five years show a slight decline of about 2.1%, highlighting the cyclical nature of electronics retail rather than a structural collapse in profitability.
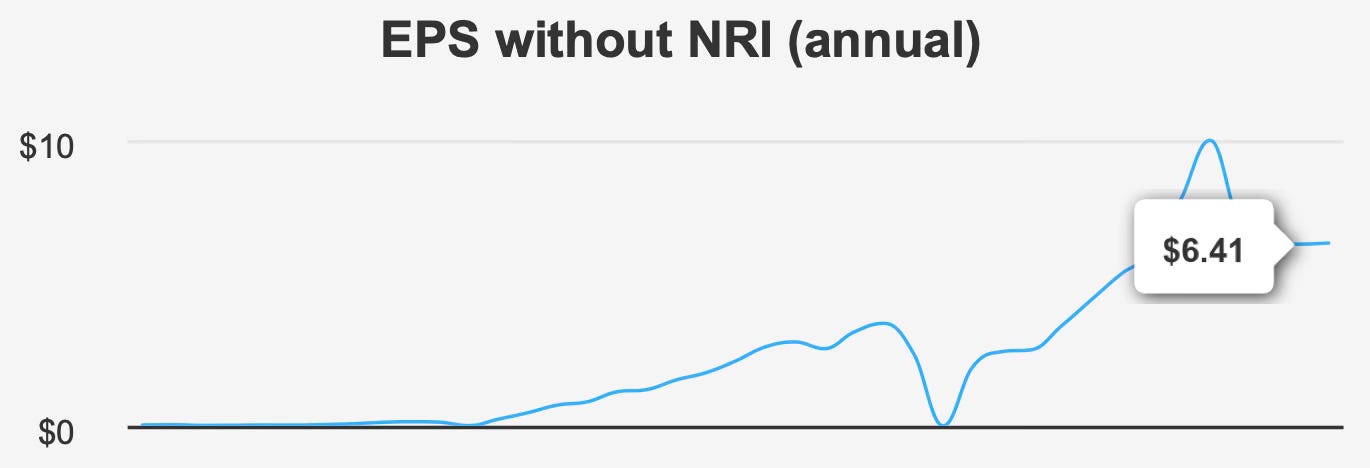
Forward expectations imply stabilization. Analysts project fiscal-year EPS of $5.18 for 2026 and $6.48 for 2027, suggesting a recovery phase rather than stagnation. Revenue is also expected to edge higher from roughly $41.8 billion in 2026 to $43.0 billion by 2028. These forecasts imply low-single-digit top-line growth combined with operating leverage — a typical pattern for mature retailers.
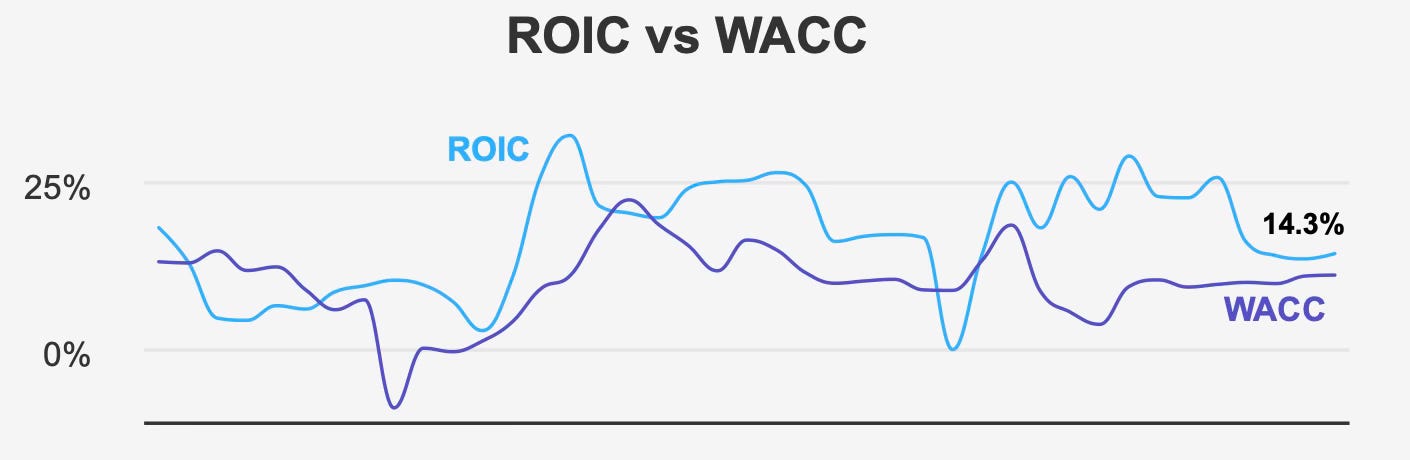
Profitability metrics reinforce the stability of the franchise. The company currently generates a 14.3% return on invested capital against an 11.1% cost of capital, meaning the firm continues to create economic value. Over the past five years, median ROIC of 15.9% has consistently exceeded the 9.8% median WACC.
Return on equity stands at 23.0%, while return on assets averages 8.5%, both solid levels for a retailer operating in a competitive sector. Gross margins around 22.5% remain stable relative to historical norms, showing that pricing pressure has not materially impaired the business model.
The primary weakness is a gradual decline in operating margin over five years, indicating rising costs or competitive intensity. However, profitability remains comfortably above the company’s cost of capital, meaning the business still compounds shareholder value despite cyclical headwinds.
Share repurchases also meaningfully support per-share earnings. The company has retired roughly 4.3% of shares over five years and 1.8% in the past year, enhancing EPS growth even in low-revenue-growth environments.
Overall, Best Buy’s earnings profile suggests a mature but economically profitable retailer: slow top-line expansion, moderate margin pressure, and shareholder returns supported by capital allocation rather than expansion.
3. Dividend Profile & Sustainability
Best Buy’s dividend stands out primarily for its combination of yield and historical growth. The forward yield of approximately 5.7% is near the highest level in its history and substantially above the long-term norm. Rather than signaling distress, the elevated yield reflects share price compression.
The payout ratio sits at 59%, indicating earnings comfortably cover distributions. While the dividend coverage ratio of 0.8 suggests limited short-term excess coverage, the company’s profitability and free-cash-flow generation remain supportive.
Dividend growth has been strong historically — roughly 15.1% annually over five years and 10.3% over three years — although future growth is expected to slow to about 5.7%. This deceleration aligns with slower earnings growth and reflects maturity rather than financial strain.
The payment schedule also demonstrates reliability. With the most recent ex-dividend date on December 16, 2025 and a payout on January 6, 2026, the next expected ex-dividend date would fall in mid-March 2026, consistent with quarterly distributions.
Crucially, dividend sustainability depends on economic profitability, not just earnings coverage. Because ROIC exceeds WACC, dividends are funded by value-creating operations rather than balance-sheet erosion. This distinguishes Best Buy from high-yield retailers whose payouts rely on leverage.
Share repurchases further complement income returns. Combined dividends and buybacks represent a meaningful shareholder yield, reducing dependence on dividend growth alone to deliver investor returns.
In practical terms, investors should expect moderate dividend growth rather than high growth going forward. The current yield compensates for slower increases, effectively front-loading shareholder returns while earnings stabilize.
4. Valuation: Market Pricing Reflects Cyclicality Rather Than Structural Decline
Best Buy’s valuation appears compressed relative to both intrinsic value and normalized earnings power. The stock trades near $66 compared with an intrinsic estimate of $76.44, implying a discount of roughly 12.5%.
The forward P/E sits near 10.0x, far below the trailing multiple of 22.2x and below the historical median of 13.8x. This large gap suggests the market expects earnings normalization rather than collapse — essentially pricing a cyclical downturn.
Enterprise valuation shows a similar pattern. The EV/EBITDA multiple around 9.4x stands above the long-term median of 7.4x but remains well below historical highs near 11.5x. In other words, the stock is neither distressed nor expensive — it sits in a mid-cycle valuation range despite depressed sentiment.
The price-to-book ratio of 5.3x, slightly below the 10-year median of 5.8x, indicates investors are not assigning a premium for growth but are still recognizing the company’s profitability.
Price targets have declined modestly to $79.63 from $82.22, reflecting macro caution rather than company-specific deterioration. The valuation picture therefore shows a consistent theme: the market expects slow growth but not financial distress.
When combined with a near-peak dividend yield and positive economic profit spread, the valuation suggests the stock is priced closer to a melting-ice-cube retailer than a stable cash-generating franchise. The discount therefore appears driven more by uncertainty about electronics demand cycles than by balance-sheet risk or competitive collapse.
5. Risk Assessment & Capital Structure Considerations
The principal risk lies in operating pressure rather than financial fragility. Operating margin has declined over the past five years, and revenue per share has weakened over the past three years, highlighting competitive and cost challenges.
Leverage remains moderate. Debt-to-EBITDA of 2.28 suggests manageable obligations for a stable retailer but still warrants monitoring in downturns.
Financial health indicators are reassuring. An Altman Z-score of 3.49 implies low bankruptcy risk, while a Beneish M-score of -2.76 suggests low likelihood of accounting manipulation.
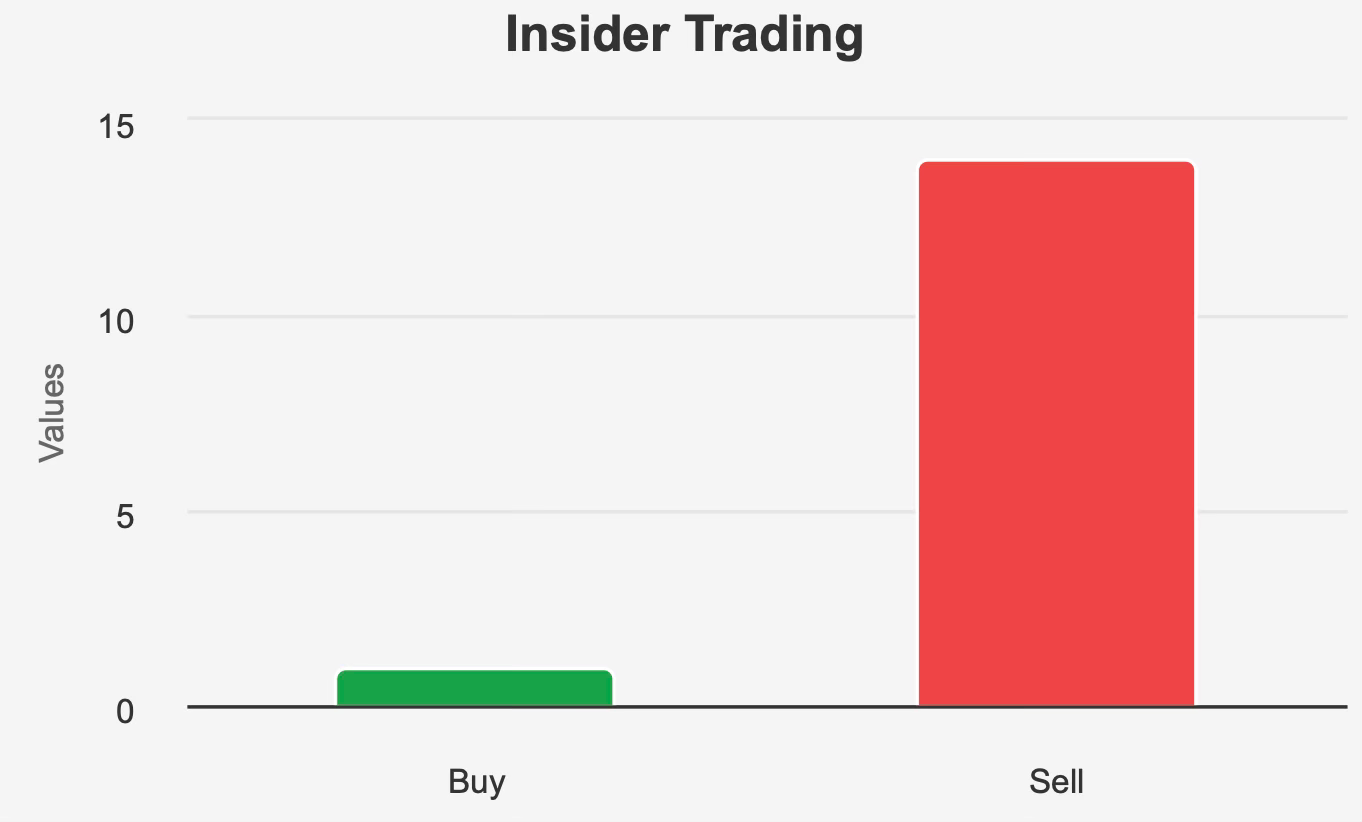
Ownership patterns introduce a mixed signal. Insider ownership stands at only 2.55%, and insiders have sold shares over the past year, potentially indicating cautious internal sentiment. However, institutional ownership above 90% reflects strong external confidence in the long-term outlook.
Liquidity remains strong, with average daily trading volume exceeding 4.3 million shares, and a high dark-pool activity level indicates continued institutional participation.
Overall risk therefore centers on earnings cyclicality rather than solvency. The company’s economic profitability and balance sheet reduce the likelihood of dividend impairment, but consumer electronics demand swings could produce earnings volatility.
Final Assessment
Best Buy occupies an unusual position in the dividend universe. It combines a high yield, positive economic profitability, moderate leverage, and discounted valuation — characteristics rarely found together without structural deterioration.
The market appears to be pricing the company as a declining retailer, yet profitability metrics show continued value creation. Earnings growth is modest, margins face pressure, and revenue expansion is slow, but none of these conditions threaten the company’s ability to fund dividends.
The dividend itself appears sustainable, though future growth will likely moderate to mid-single digits. Investors are effectively compensated upfront through yield rather than long-term growth.
Valuation offers a margin of safety primarily because expectations are low. If earnings merely stabilize rather than deteriorate, the stock could re-rate toward historical multiples while continuing to deliver income.
Best Buy therefore suits investors seeking income with moderate cyclical exposure. The risk lies in consumer spending sensitivity, while the reward lies in receiving a high ongoing yield from a company still earning above its cost of capital.
In sum, the stock represents a yield-supported value opportunity: not a high-growth compounder, but a cash-returning retailer whose market discount appears larger than its underlying business risk.