
Amcor PLC: Income Stability Confronts Capital Efficiency Pressures
A 5.2% Yield Backed by Moderate Payouts, but Tested by Elevated Leverage and Subdued Growth

Investment Thesis: High Yield Supported by Stable Cash Flows, but Constrained by Slowing Growth and Capital Efficiency Drift
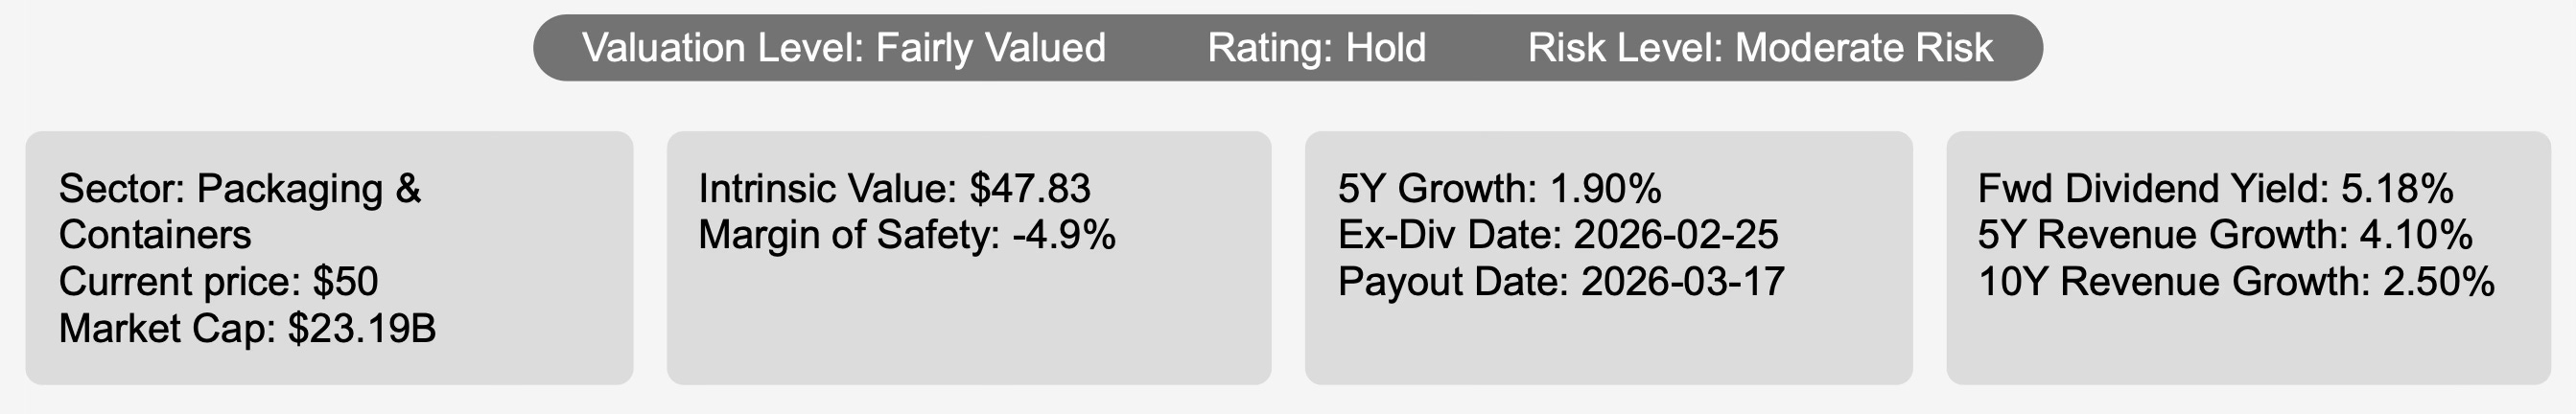
Amcor PLC AMCR 0.00%↑ operates as a global producer of plastic packaging, with roughly 90% of earnings derived from flexible packaging for food, beverage, healthcare, and hygiene products. The remaining exposure lies in its rigid packaging operations in North and Latin America, primarily tied to beverage bottling. Geographically diversified across more than 35 countries, approximately half of group sales are generated in North America, with the balance split between Western Europe and emerging markets. Australia and New Zealand contribute less than 5% of total sales.
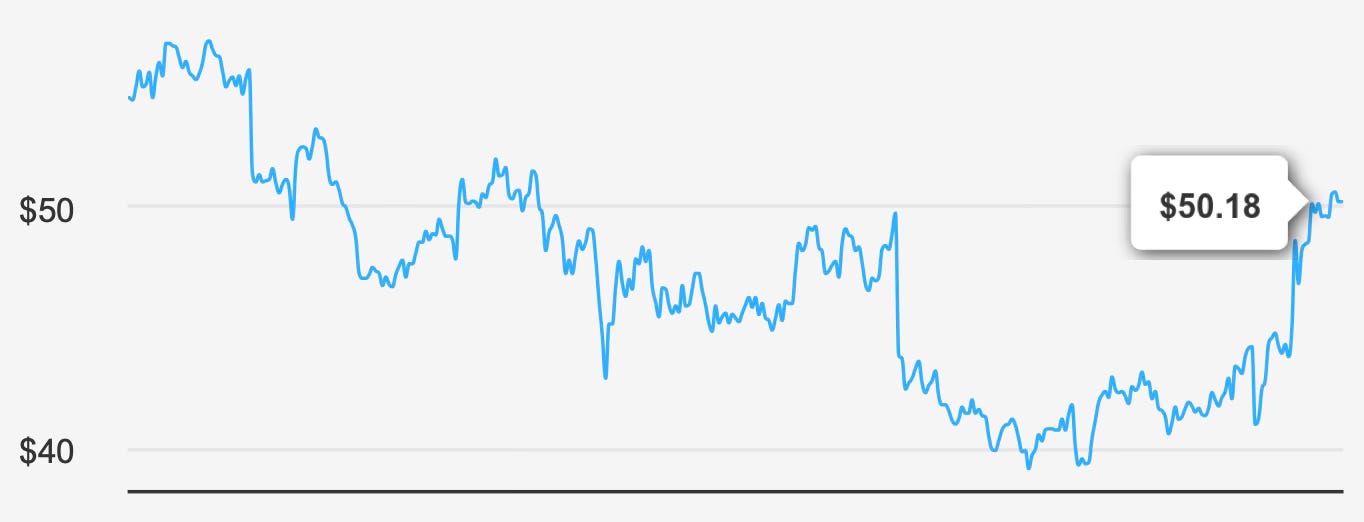
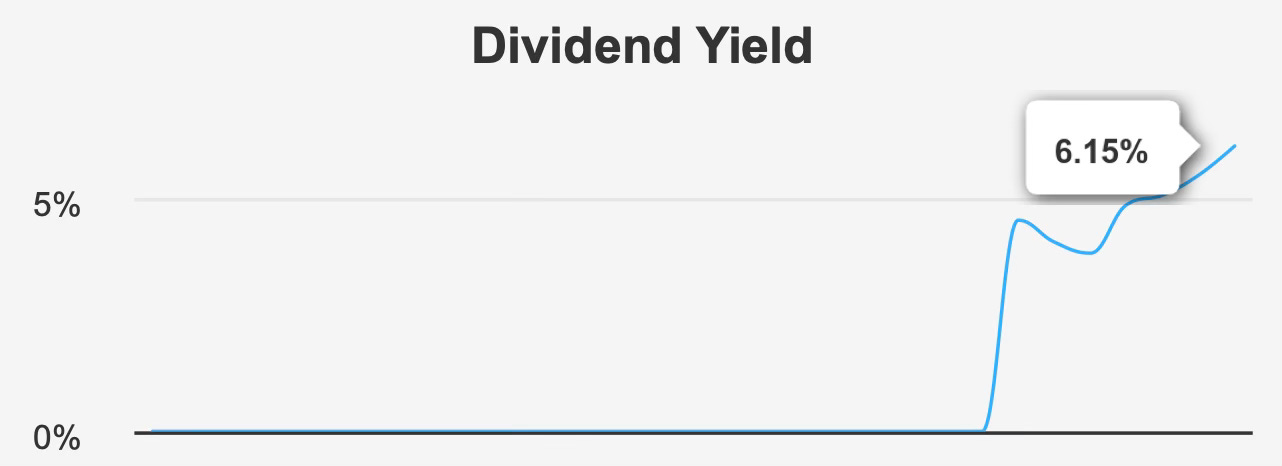
At a current share price of $50 and a market capitalization of $23.19 billion, the stock offers a forward dividend yield of 5.2%, materially above the sector’s 10-year median yield of 4.3%. The income proposition is clear: a relatively high yield supported by a 36% payout ratio and modest dividend growth. However, growth has been subdued. Five-year revenue growth stands at 4.1%, while 10-year revenue growth averages 2.5%. Dividend growth has tracked at 1.9% over five years and 2.1% over three years, with projections suggesting moderation toward 1.5% over the next three to five years.
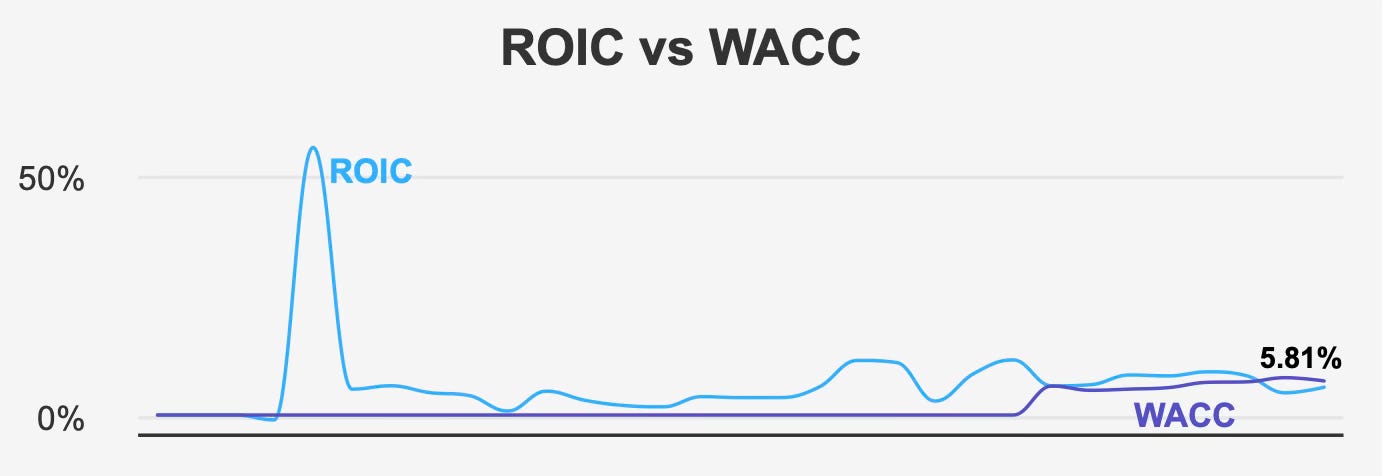
The investment case therefore rests less on growth acceleration and more on income durability. That durability is challenged by elevated leverage and a recent decline in capital returns. The company’s 5-year median return on invested capital (ROIC) of 8.2% exceeded its 5-year median weighted average cost of capital (WACC) of 6.8%, indicating historical value creation. More recently, however, ROIC has slipped to 5.8%, below the current WACC of 7.4%, signaling pressure on economic returns.
Amcor remains a credible income vehicle within the packaging sector, but its valuation leaves limited margin for error, and the balance sheet warrants ongoing monitoring.
2. Earnings Momentum & Profitability Trends
The most recent quarter ended December 31, 2025 delivered mixed signals. Earnings per share excluding non-recurring items reached $4.30, up sharply from $0.965 in the prior quarter and $0.805 in the comparable period last year. By contrast, diluted EPS came in at $0.38, down from $0.565 in the previous quarter and $0.56 a year earlier.
Revenue per share declined sequentially to $11.749 from $12.408, though it improved versus $11.211 in the prior year quarter. The divergence between adjusted and reported figures underscores earnings volatility that investors must account for when evaluating forward sustainability.
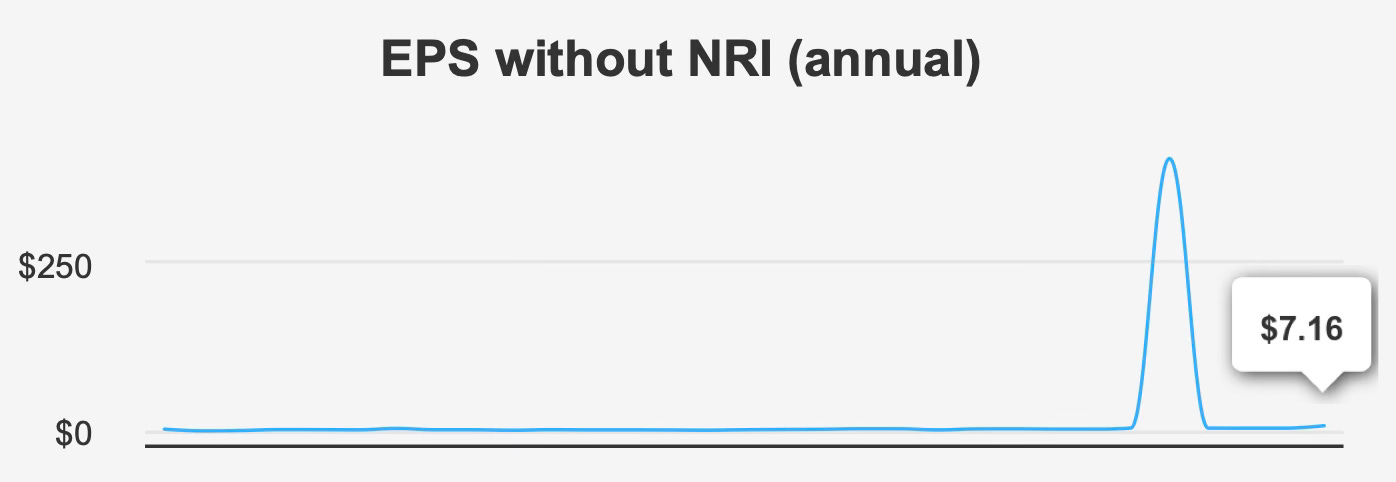
Longer-term earnings performance presents a bifurcated picture. Over the past decade, annual EPS excluding non-recurring items has compounded at 18.0%. However, the past five years reflect an annual decline of 6.9%, suggesting that the earlier growth trajectory has not been sustained.
Margins reinforce this moderation. Gross margin for the quarter stood at 18.9%, slightly below the 5-year median of 19.4% and only modestly above the 10-year low of 18.5%. Risk & Reward analysis further highlights margin contraction, with gross and operating margins declining at rates of 1.7% and 1.5%, respectively.
Return metrics also show deterioration. The 5-year median return on assets (ROA) of 4.7% and return on equity (ROE) of 18.5% historically indicated efficient capital deployment. Currently, ROE has fallen to 7.0%, and ROIC at 5.8% now trails the 7.4% WACC. This shift from economic value creation to potential value erosion represents a material inflection point.
Looking ahead, analysts forecast EPS of 2.599 for fiscal 2026 and 3.334 for the following year, with revenue projected to reach $22,994.08 million by mid-2026. The forward P/E of 12.5x, well below the trailing 32.8x multiple, implies expectations for earnings normalization. Whether those improvements restore returns above the cost of capital remains central to the long-term thesis.
3. Dividend Profile & Sustainability
Amcor’s dividend profile is defined by stability rather than acceleration. The forward yield of 6.2% stands attractively above the sector median, and the most recent quarterly dividend increased modestly to $0.65 per share from $0.6375.
Dividend growth has averaged 1.9% over five years and 2.1% over three years. Forward projections suggest growth may moderate to approximately 1.5% over the next three to five years. While incremental, this trajectory remains consistent with the company’s earnings profile and mature industry positioning.
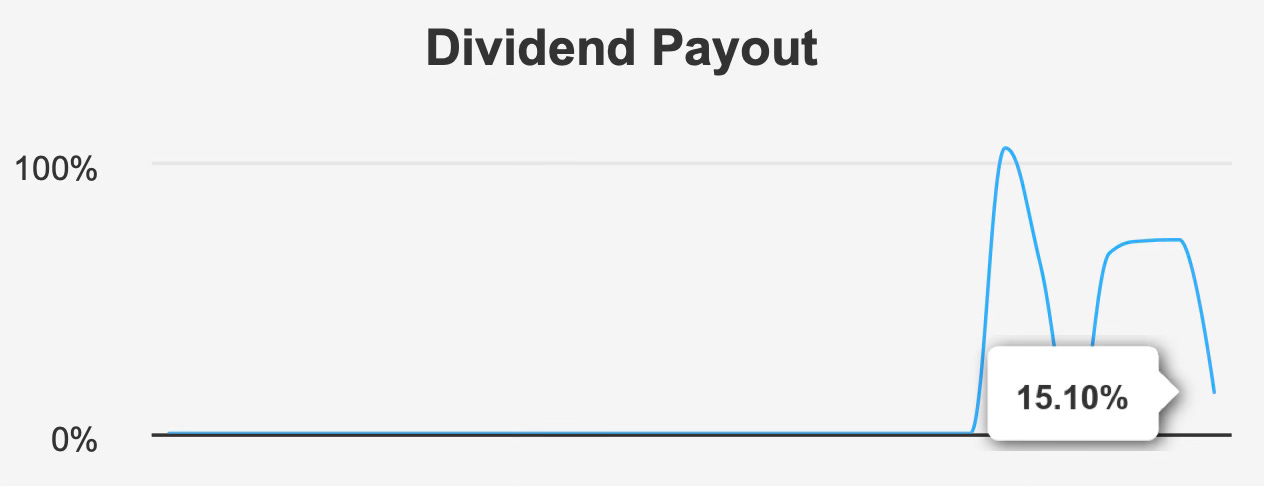
The payout ratio of 15.10% is conservative in isolation and provides flexibility. Dividend coverage is reported at 0.6, and distributions are paid quarterly, with the next ex-dividend date set for February 25, 2026 and payment scheduled for March 17, 2026.
However, leverage introduces complexity. Debt-to-EBITDA stands at 6.6x, above levels typically associated with moderate financial risk. Over the past three years, the company has issued $2.6 billion in long-term debt, increasing reliance on borrowed capital. Asset growth of 12.4% annually has significantly outpaced revenue growth of 4.1%, potentially signaling suboptimal capital allocation.
The Altman Z-score of 1.27 places the company in the distress zone, implying elevated financial risk over a two-year horizon. While the dividend is presently well covered, sustained margin pressure or refinancing challenges could constrain future increases.
For now, the income stream appears secure, but balance sheet strength will determine whether modest growth can continue uninterrupted.
4. Valuation: Limited Margin of Safety Despite Below-Median Forward Multiples
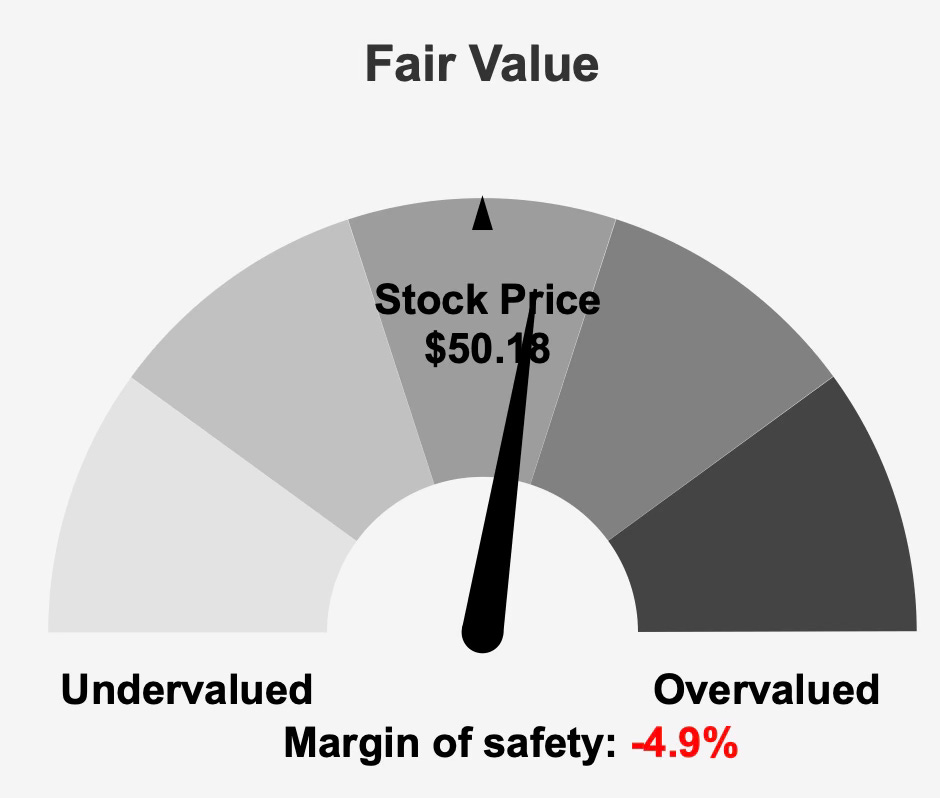
The stock’s intrinsic value is estimated at $47.83, compared to a market price of $50.18, resulting in a negative margin of safety of 4.9%. In other words, shares trade slightly above modeled fair value.
Valuation metrics are mixed. The trailing P/E of 32.8x sits near its 5-year peak and above the 10-year median of 21.4x. Historically, the P/E has ranged from 12.9x to 53.0x over the past decade. By contrast, the forward P/E of 12.5x suggests anticipated earnings improvement and potential multiple compression.
On a revenue basis, the TTM price-to-sales ratio of 1.04x is slightly below the 10-year median of 1.19x, indicating a more neutral stance relative to sales. However, EV/EBITDA at 15.7x exceeds its 10-year median of 12.6x, implying that enterprise value relative to operating earnings remains elevated. Similarly, the price-to-free-cash-flow ratio of 25.0x stands above its 10-year median of 19.0x.
Analyst price targets cluster around $53.47, modestly above the current price, indicating limited upside expectations. Taken together, valuation does not present a compelling discount. Instead, it reflects a fairly valued income-oriented security with constrained appreciation potential unless earnings growth materially outperforms forecasts.
5. Risk Assessment & Capital Structure Considerations
Several risk factors warrant close attention. The most prominent is leverage. A Debt-to-EBITDA ratio of 6.6x combined with $2.6 billion in long-term debt issuance over three years elevates refinancing and interest-rate sensitivity risk.
The divergence between asset growth of 12.4% and revenue growth of 4.1% raises questions regarding return efficiency. With ROIC below WACC, incremental investment currently appears to dilute rather than enhance value.
Liquidity remains adequate, with daily trading volume of 4,405,607 shares, though this is below the 2-month average of 5,686,755 shares. The Dark Pool Index of 44.7% indicates substantial off-exchange trading, often associated with institutional participation.
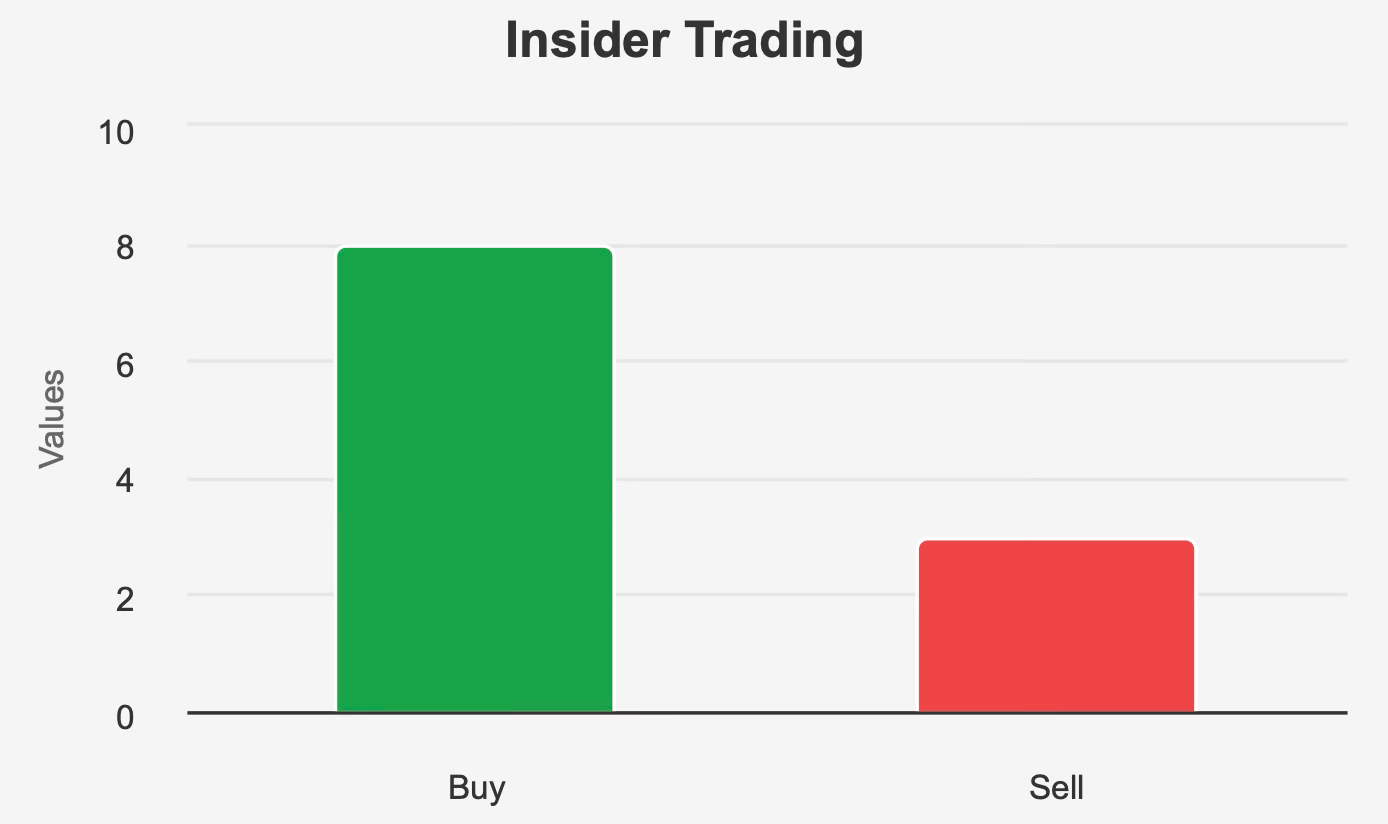
Ownership structure further contextualizes governance dynamics. Insider ownership stands at 1.7%, while institutional ownership is 65.8%. Over the past 12 months, insiders executed eight purchase transactions versus three sales, indicating net buying. More recently, however, the past three months showed two sales and one purchase, suggesting short-term caution.
The Altman Z-score of 1.27 introduces additional balance sheet sensitivity. While not determinative, it reinforces the need for disciplined capital allocation and earnings stabilization.
Final Assessment
Amcor presents a clear profile: a globally diversified packaging company offering a 5.2% forward yield supported by a modest 36% payout ratio and steady, if slow, dividend growth. Its business mix provides defensiveness tied to consumer staples demand, and historical capital returns have exceeded the cost of capital.
However, recent deterioration in ROIC, declining margins, and elevated leverage complicate the narrative. With ROIC at 5.8% versus a 7.4% WACC, value creation has stalled. Debt metrics and a Z-score in the distress zone introduce balance sheet risk that income-focused investors must not overlook.
Valuation appears broadly fair. Shares trade slightly above intrinsic value, and while the forward P/E of 12.5x suggests earnings recovery, other metrics such as EV/EBITDA at 15.7x and P/FCF at 25.0x remain elevated relative to historical medians.
For long-term dividend investors prioritizing yield over growth, Amcor may serve as a stable income holding, provided leverage trends improve and earnings normalize as projected. For investors seeking capital appreciation or accelerating dividend growth, the current profile offers limited catalysts.
In sum, Amcor stands as a moderately risky, fairly valued income security. The dividend is sustainable under present conditions, but balance sheet discipline and return restoration will determine whether the company can convert yield strength into durable shareholder value.